 4
4peptides
spectra
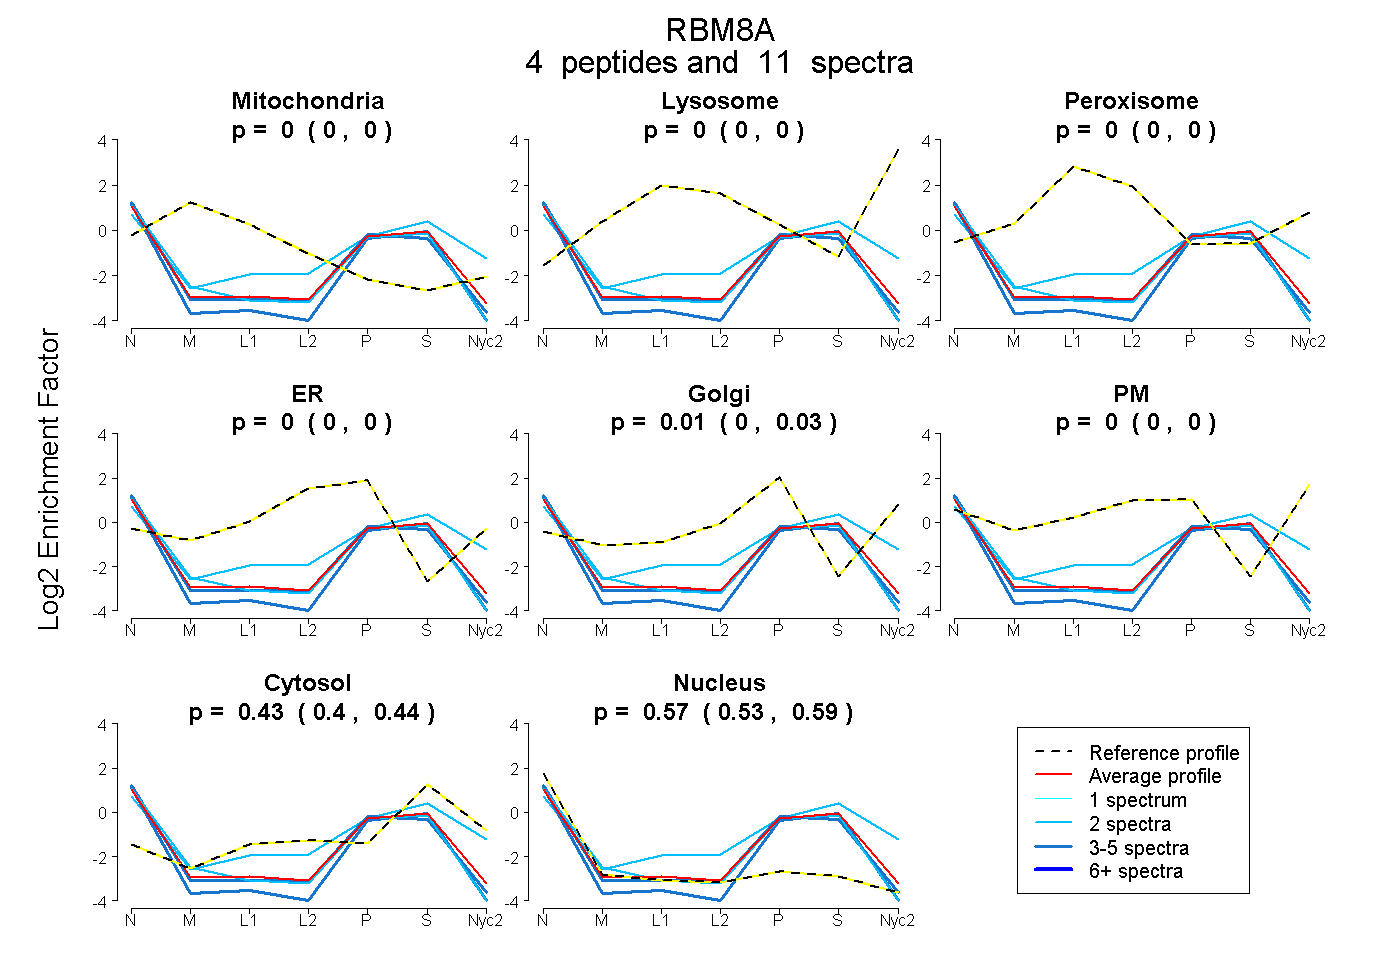
0.000 | 0.000
0.000 | 0.000
0.000 | 0.000
0.000 | 0.000
0.000 | 0.030
0.000 | 0.000
0.403 | 0.442
0.534 | 0.592
1peptide
spectra
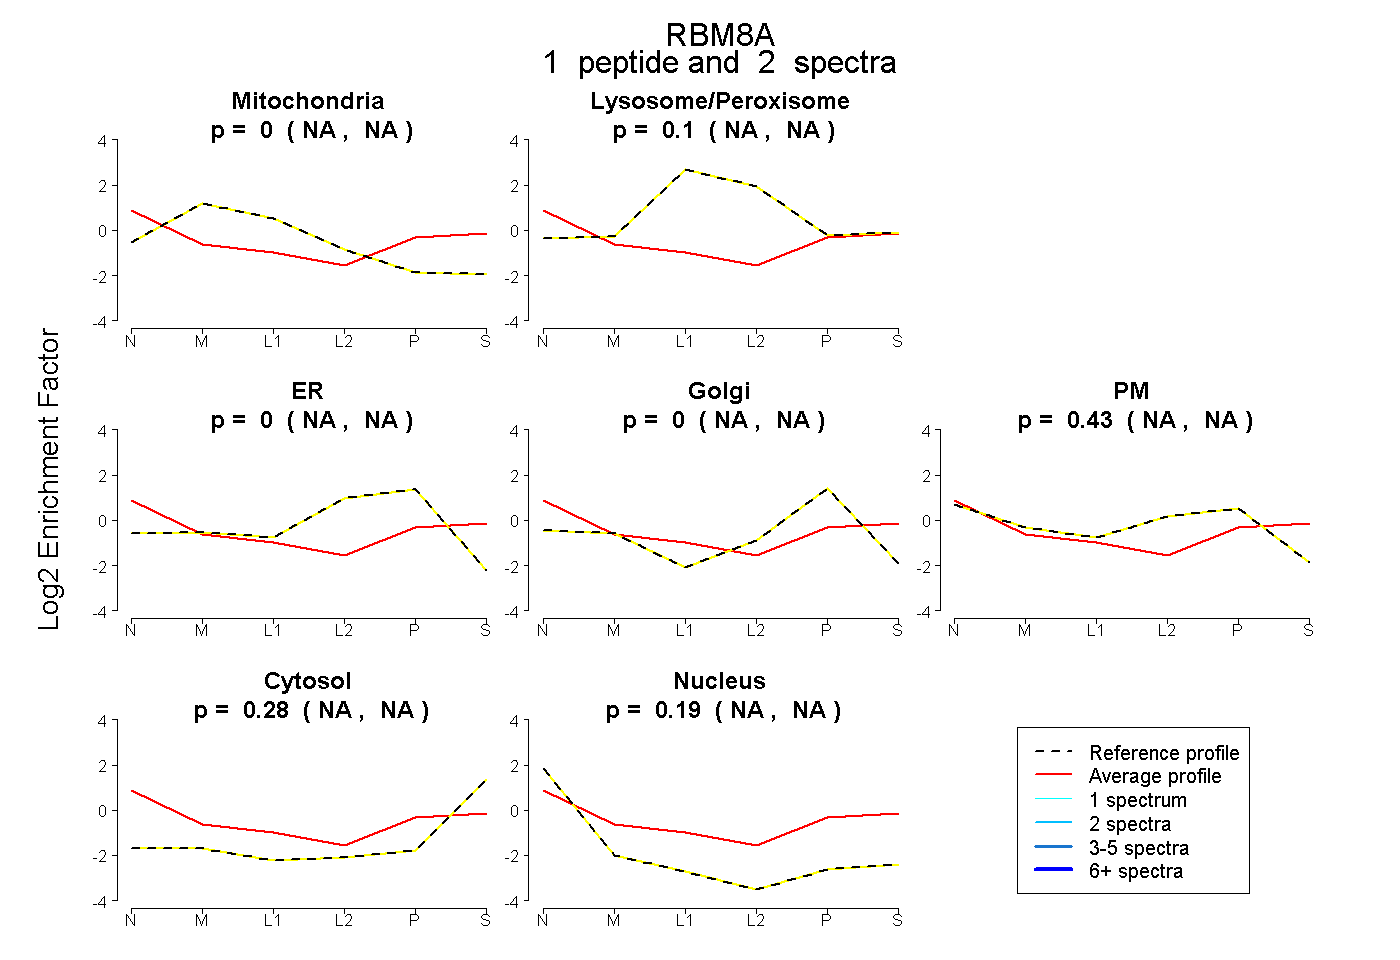
NA | NA
NA | NA
NA | NA
NA | NA
NA | NA
NA | NA
NA | NA
| Plot | Mito | Lyso | Perox | ER | Golgi | PM | Cytosol | Nucleus | |||||
| Expt A |
4 peptides |
11 spectra |
|
0.000 0.000 | 0.000 |
0.000 0.000 | 0.000 |
0.000 0.000 | 0.000 |
0.000 0.000 | 0.000 |
0.005 0.000 | 0.030 |
0.000 0.000 | 0.000 |
0.428 0.403 | 0.442 |
0.566 0.534 | 0.592 |
||
| Plot | Mito | Lyso or Perox | ER | Golgi | PM | Cytosol | Nucleus | ||||||
| Expt B |
1 peptide |
2 spectra |
|
0.000 NA | NA |
0.099 NA | NA |
0.000 NA | NA |
0.000 NA | NA |
0.431 NA | NA |
0.279 NA | NA |
0.191 NA | NA |
| 2 spectra, NIHLNLDR | 0.000 | 0.099 | 0.000 | 0.000 | 0.431 | 0.279 | 0.191 |
| Plot | Lyso | Other | |||||||||||
| Expt C |
2 peptides |
2 spectra |
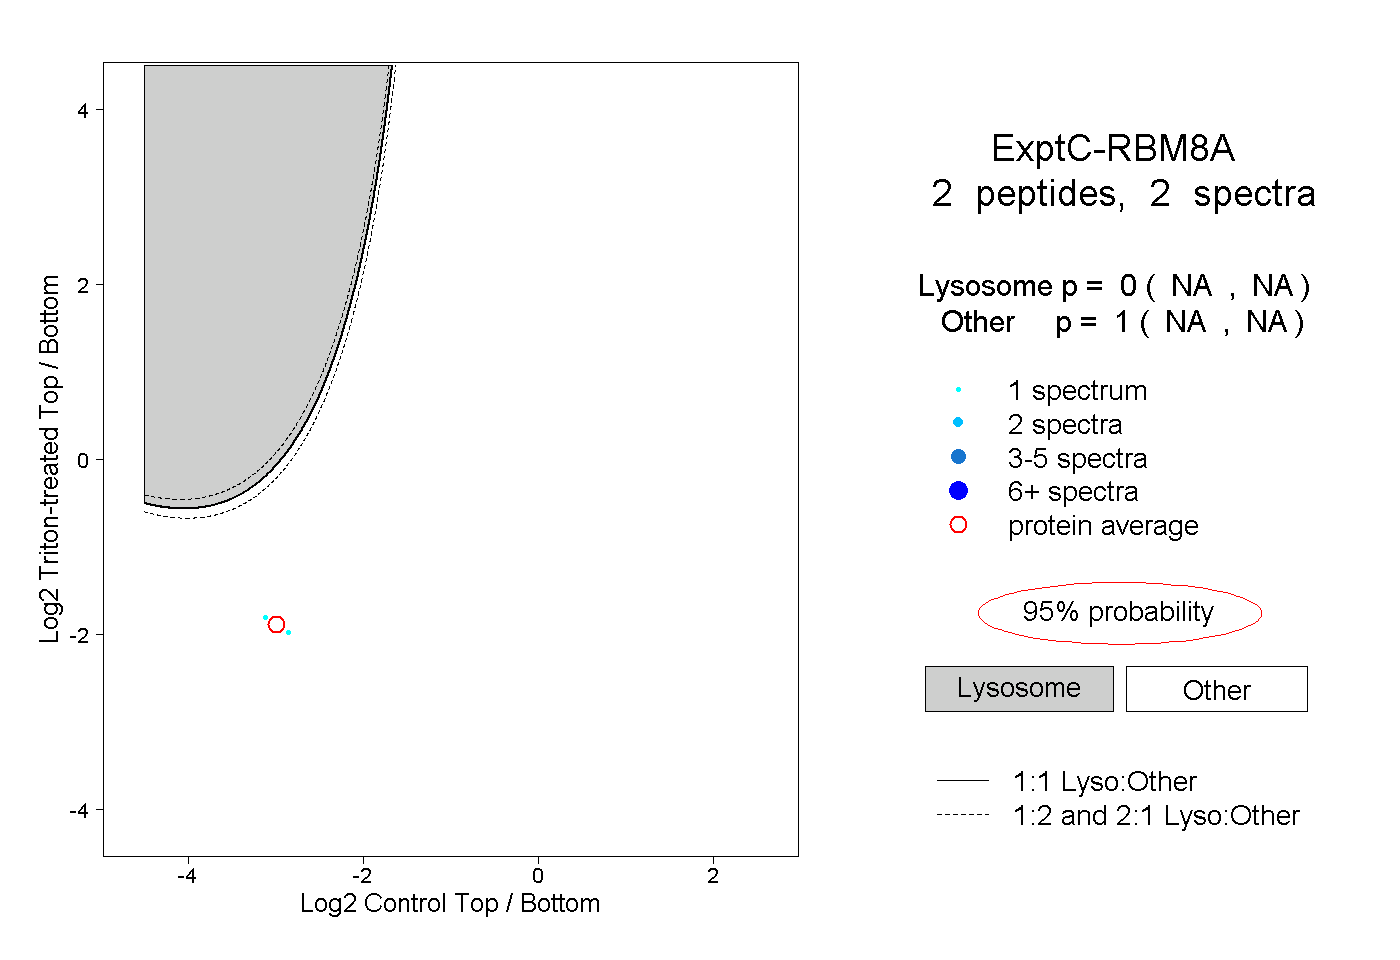 |
0.000 NA | NA |
1.000 NA | NA |