 3
3peptides
spectra
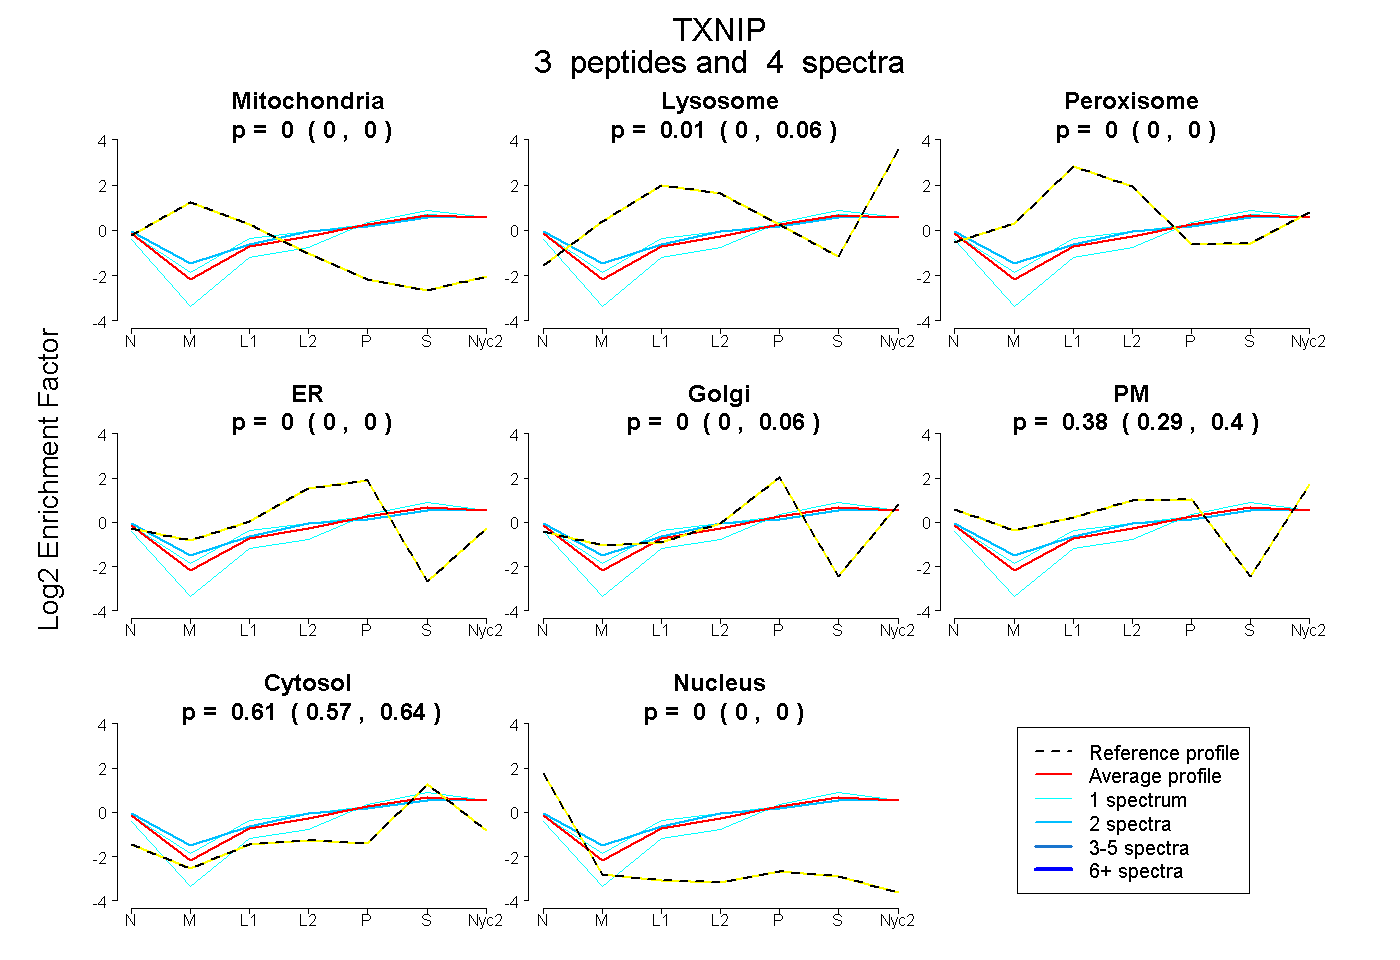
0.000 | 0.000
0.000 | 0.057
0.000 | 0.000
0.000 | 0.000
0.000 | 0.056
0.287 | 0.397
0.575 | 0.637
0.000 | 0.000
| Plot | Mito | Lyso | Perox | ER | Golgi | PM | Cytosol | Nucleus | |||||
| Expt A |
3 peptides |
4 spectra |
|
0.000 0.000 | 0.000 |
0.012 0.000 | 0.057 |
0.000 0.000 | 0.000 |
0.000 0.000 | 0.000 |
0.000 0.000 | 0.056 |
0.376 0.287 | 0.397 |
0.613 0.575 | 0.637 |
0.000 0.000 | 0.000 |
| 1 spectrum, VILDLPLVIGSR | 0.000 | 0.000 | 0.000 | 0.000 | 0.277 | 0.029 | 0.693 | 0.000 | ||
| 2 spectra, AFLDRPSQPTQEAK | 0.000 | 0.026 | 0.033 | 0.000 | 0.000 | 0.395 | 0.547 | 0.000 | ||
| 1 spectrum, AAIVAR | 0.000 | 0.046 | 0.050 | 0.000 | 0.000 | 0.342 | 0.561 | 0.000 |
| Plot | Lyso | Other | |||||||||||
| Expt C |
1 peptide |
2 spectra |
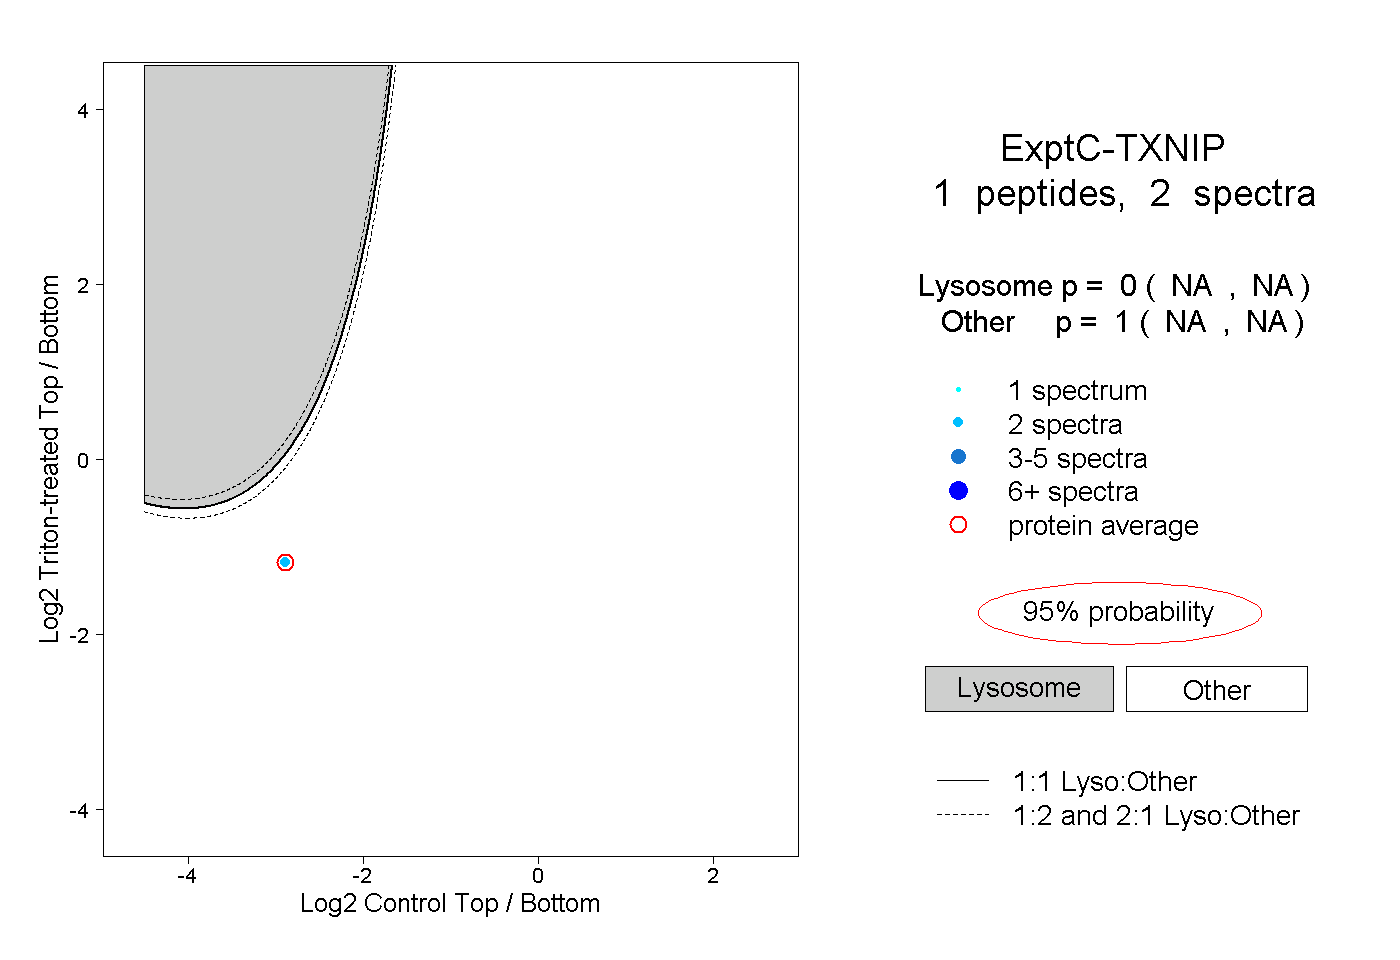 |
0.000 NA | NA |
1.000 NA | NA |