 2
2peptides
spectra
0.000 | 0.000
0.099 | 0.193
0.000 | 0.000
0.000 | 0.000
0.112 | 0.180
0.000 | 0.000
0.668 | 0.727
0.000 | 0.000
1peptide
spectrum
NA | NA
NA | NA
NA | NA
NA | NA
NA | NA
NA | NA
NA | NA
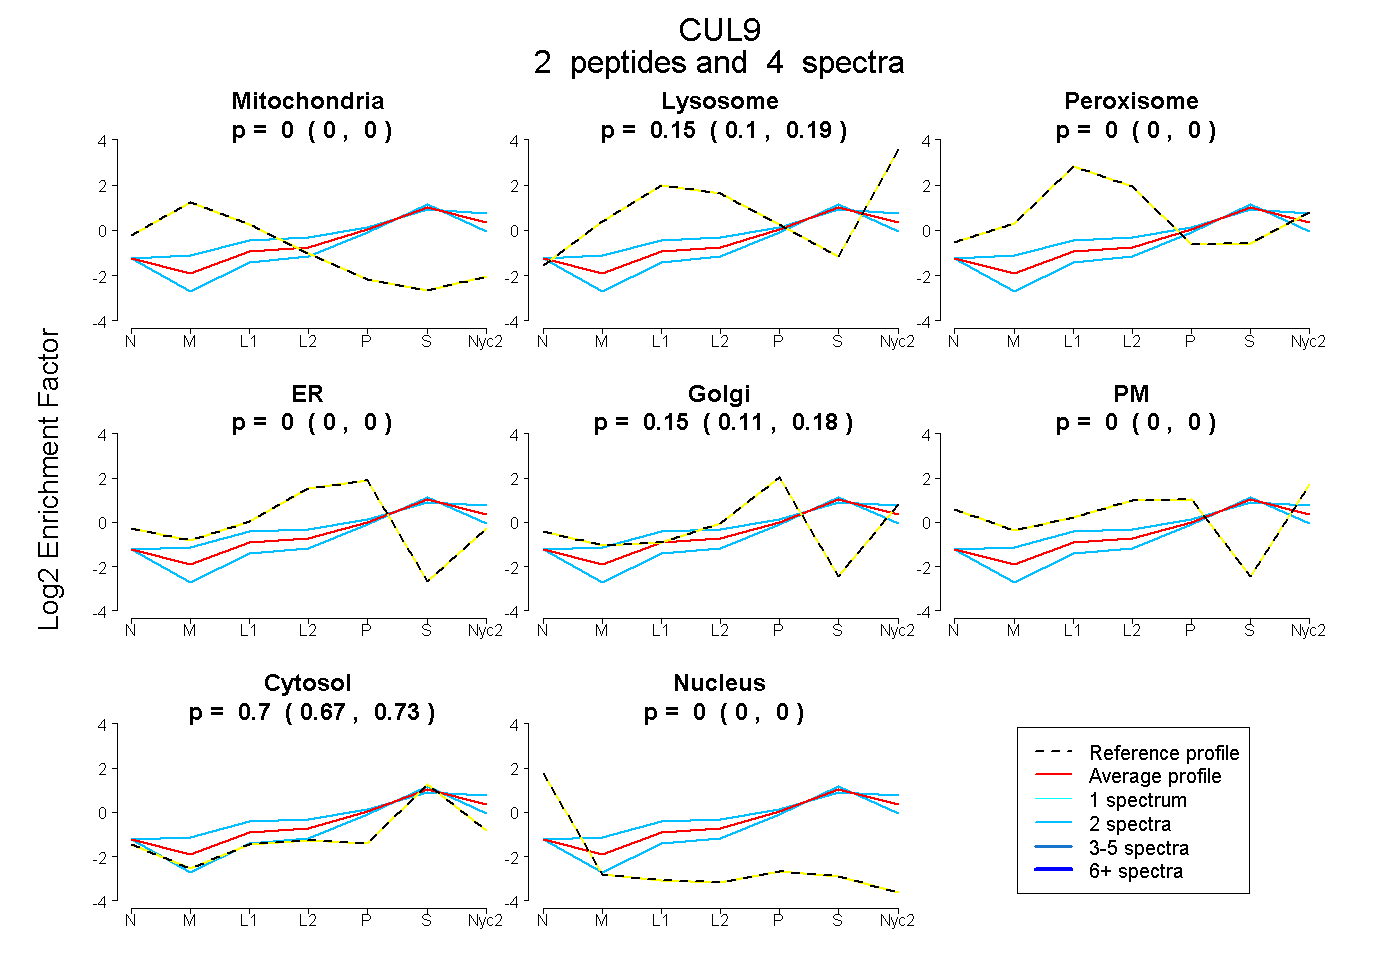
| Plot | Mito | Lyso | Perox | ER | Golgi | PM | Cytosol | Nucleus | |||||
| Expt A |
2 peptides |
4 spectra |
|
0.000 0.000 | 0.000 |
0.150 0.099 | 0.193 |
0.000 0.000 | 0.000 |
0.000 0.000 | 0.000 |
0.150 0.112 | 0.180 |
0.000 0.000 | 0.000 |
0.701 0.668 | 0.727 |
0.000 0.000 | 0.000 |
||
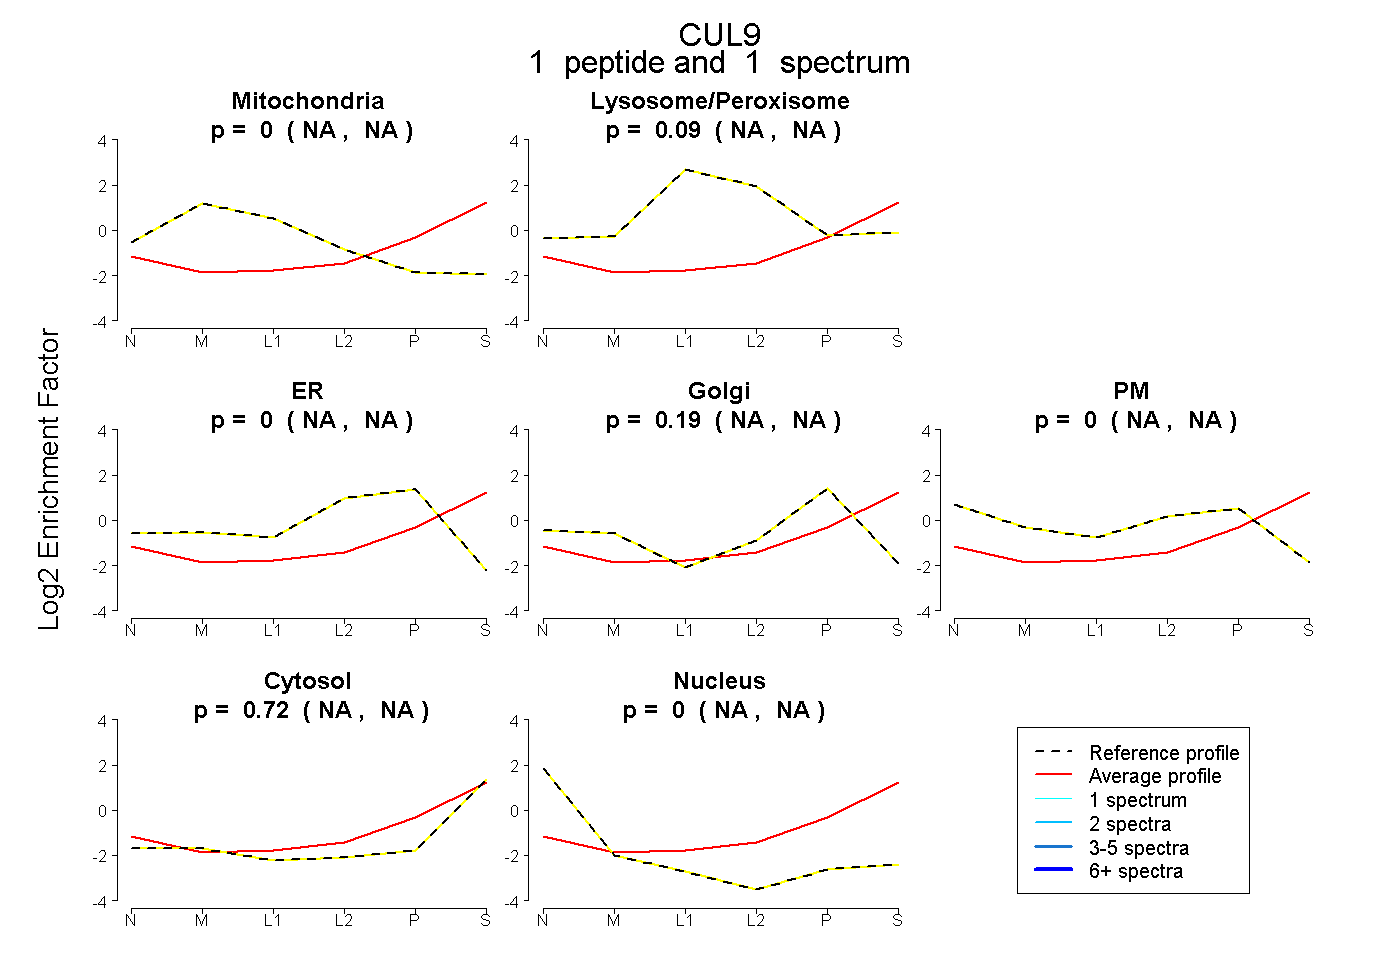
| Plot | Mito | Lyso or Perox | ER | Golgi | PM | Cytosol | Nucleus | ||||||
| Expt B |
1 peptide |
1 spectrum |
|
0.000 NA | NA |
0.088 NA | NA |
0.000 NA | NA |
0.191 NA | NA |
0.000 NA | NA |
0.721 NA | NA |
0.000 NA | NA |