 3
3peptides
spectra
0.000 | 0.000
0.000 | 0.128
0.000 | 0.303
0.000 | 0.227
0.000 | 0.355
0.241 | 0.621
0.000 | 0.137
0.000 | 0.000
3peptides
spectra
0.000 | 0.000
1.000 | 1.000
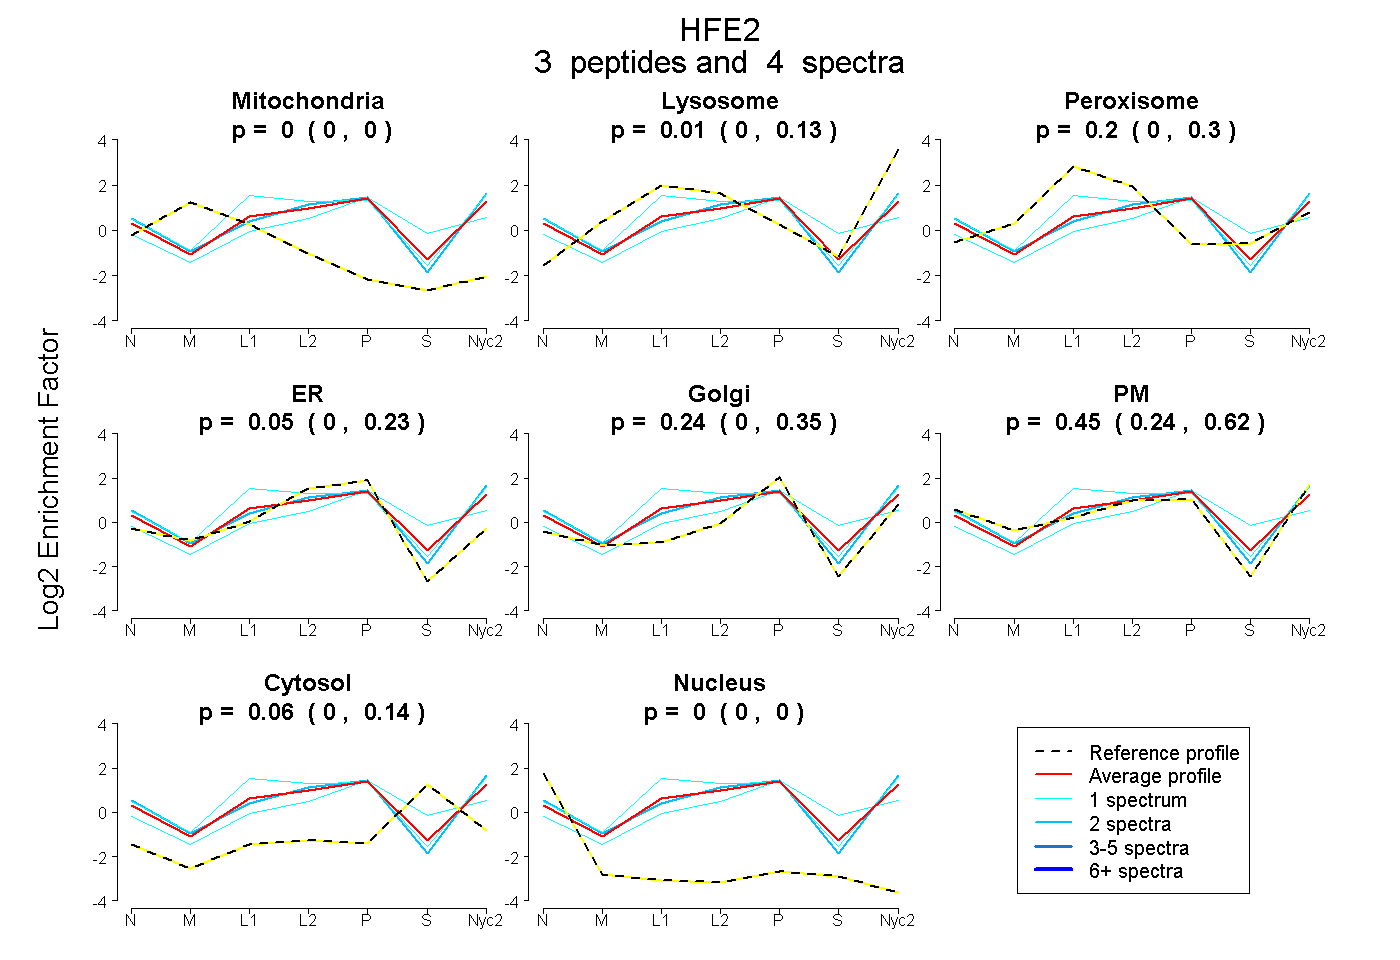
| Plot | Mito | Lyso | Perox | ER | Golgi | PM | Cytosol | Nucleus | |||||
| Expt A |
3 peptides |
4 spectra |
|
0.000 0.000 | 0.000 |
0.010 0.000 | 0.128 |
0.200 0.000 | 0.303 |
0.045 0.000 | 0.227 |
0.235 0.000 | 0.355 |
0.449 0.241 | 0.621 |
0.061 0.000 | 0.137 |
0.000 0.000 | 0.000 |
||
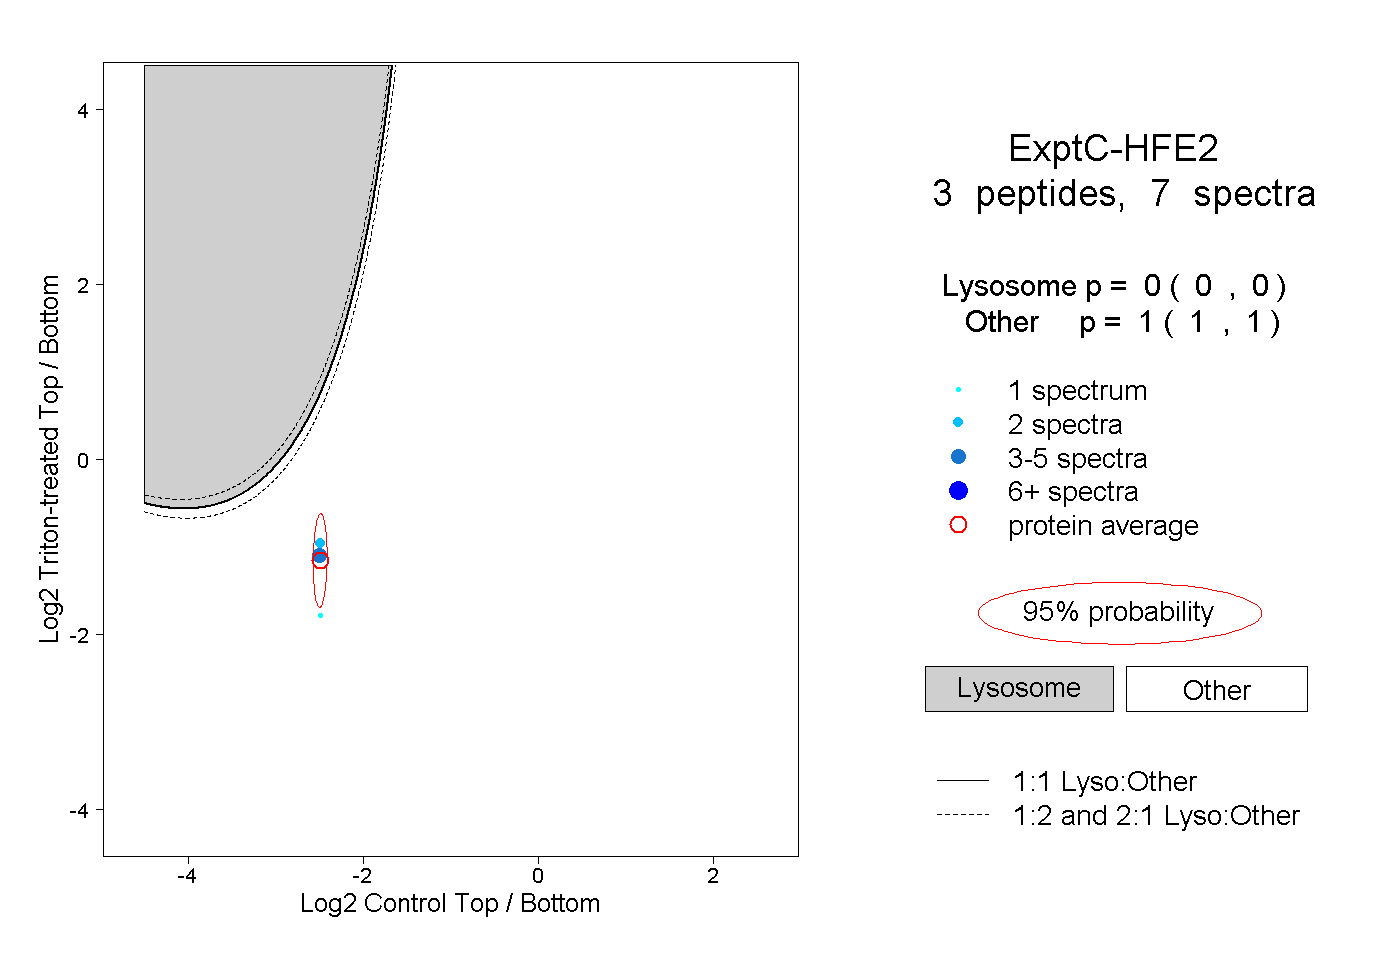
| Plot | Lyso | Other | |||||||||||
| Expt C |
3 peptides |
7 spectra |
|
0.000 0.000 | 0.000 |
1.000 1.000 | 1.000 |