 4
4peptides
spectra
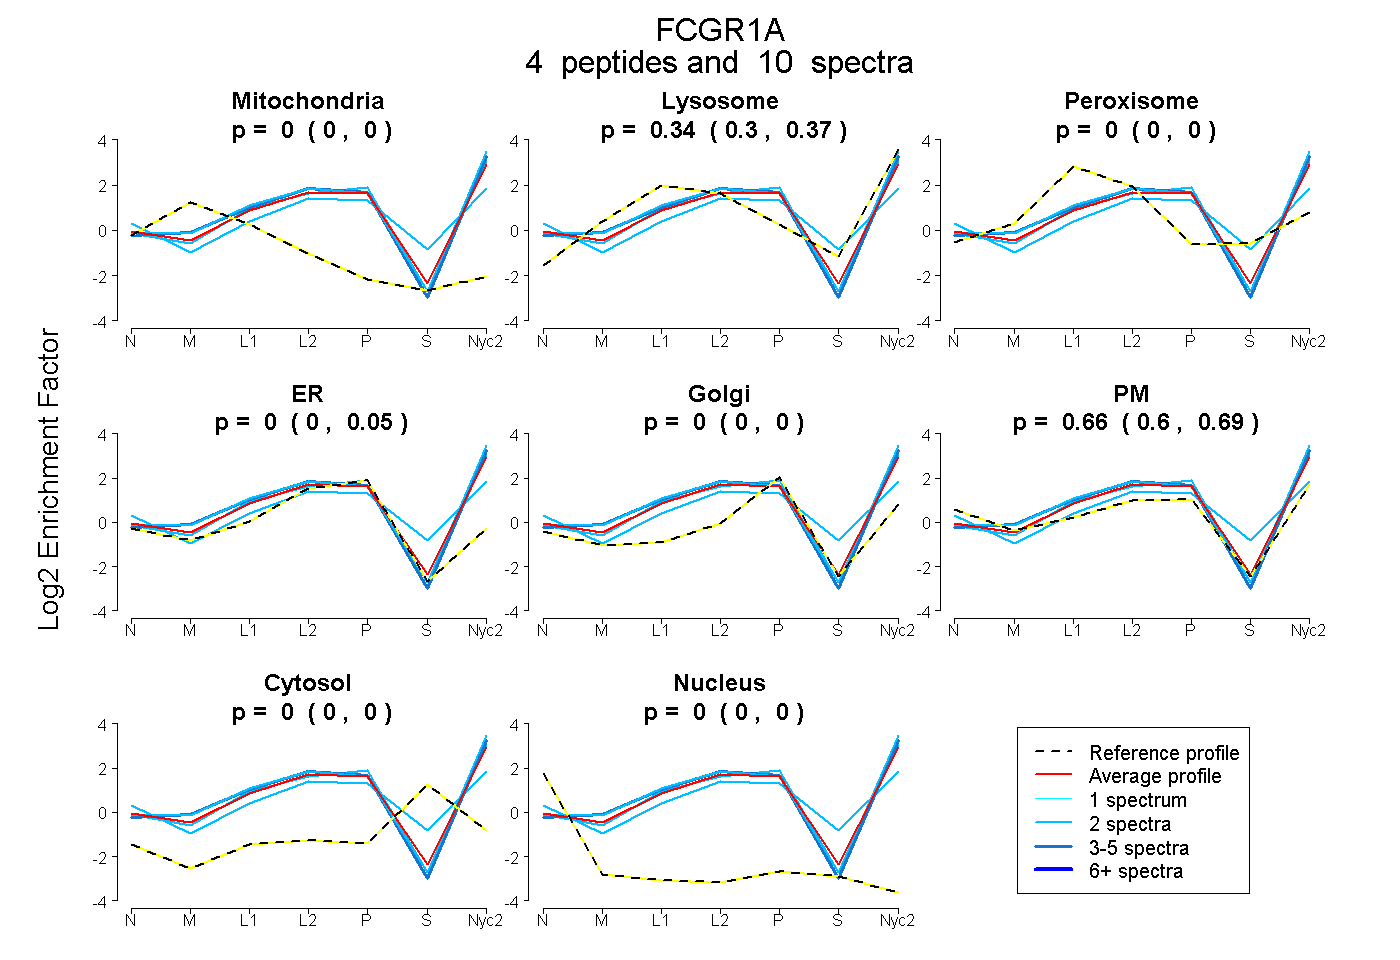
0.000 | 0.000
0.296 | 0.373
0.000 | 0.000
0.000 | 0.046
0.000 | 0.000
0.601 | 0.689
0.000 | 0.000
0.000 | 0.000
| Plot | Mito | Lyso | Perox | ER | Golgi | PM | Cytosol | Nucleus | |||||
| Expt A |
4 peptides |
10 spectra |
|
0.000 0.000 | 0.000 |
0.336 0.296 | 0.373 |
0.000 0.000 | 0.000 |
0.000 0.000 | 0.046 |
0.000 0.000 | 0.000 |
0.664 0.601 | 0.689 |
0.000 0.000 | 0.000 |
0.000 0.000 | 0.000 |
| 4 spectra, LFLQSPGLR | 0.000 | 0.393 | 0.000 | 0.000 | 0.000 | 0.607 | 0.000 | 0.000 | ||
| 2 spectra, VLTEGEPLALR | 0.000 | 0.436 | 0.000 | 0.000 | 0.000 | 0.564 | 0.000 | 0.000 | ||
| 2 spectra, ATSFQQVR | 0.000 | 0.317 | 0.000 | 0.000 | 0.003 | 0.680 | 0.000 | 0.000 | ||
| 2 spectra, DWLLLQTSHR | 0.000 | 0.215 | 0.008 | 0.082 | 0.000 | 0.575 | 0.121 | 0.000 |
| Plot | Lyso | Other | |||||||||||
| Expt C |
6 peptides |
17 spectra |
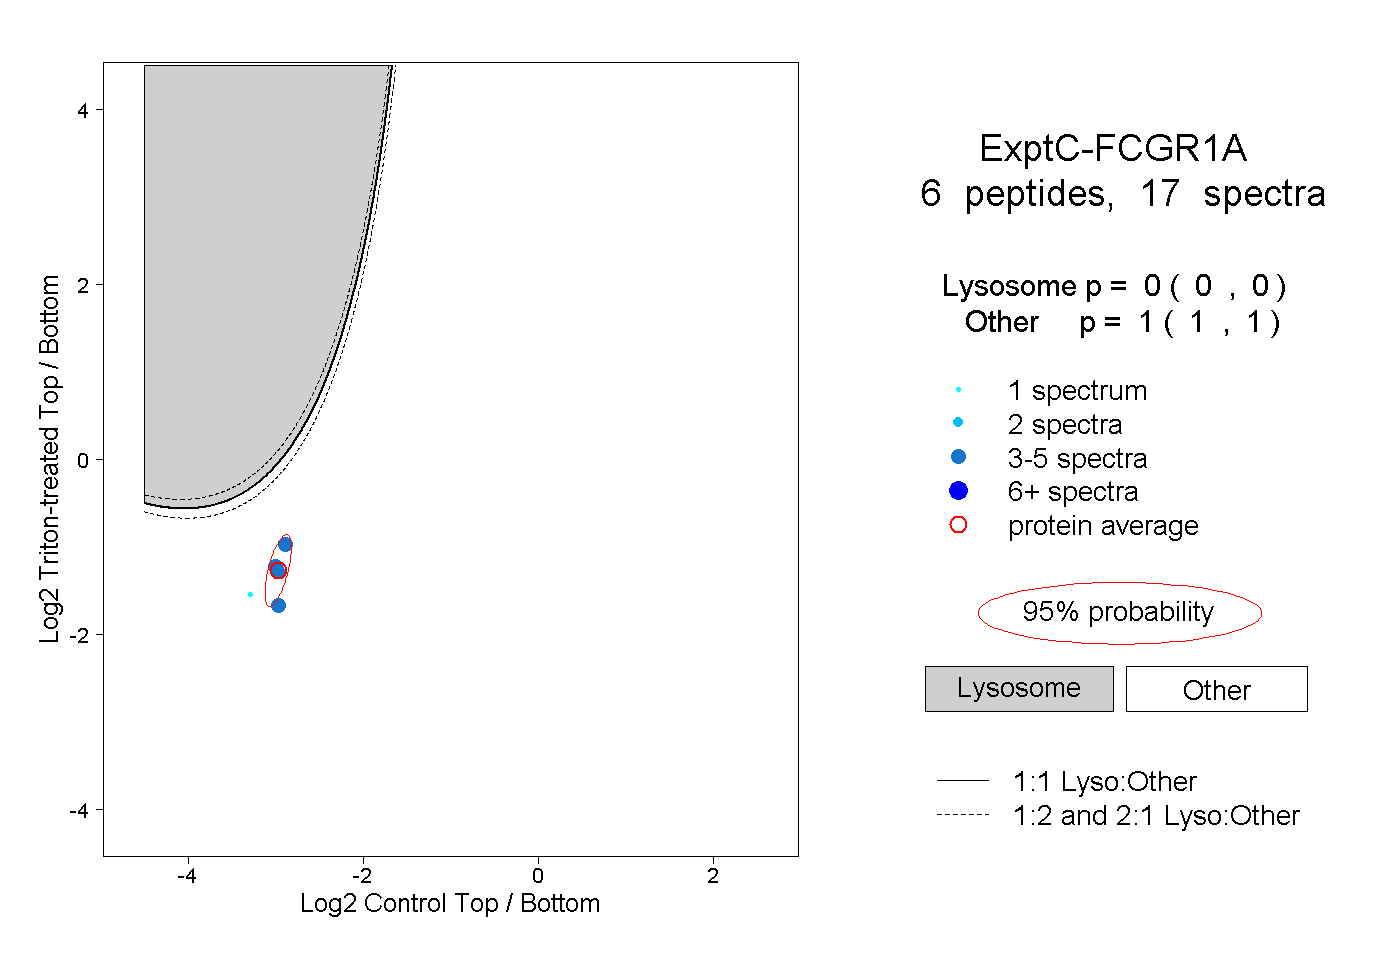 |
0.000 0.000 | 0.000 |
1.000 1.000 | 1.000 |