 4
4peptides
spectra
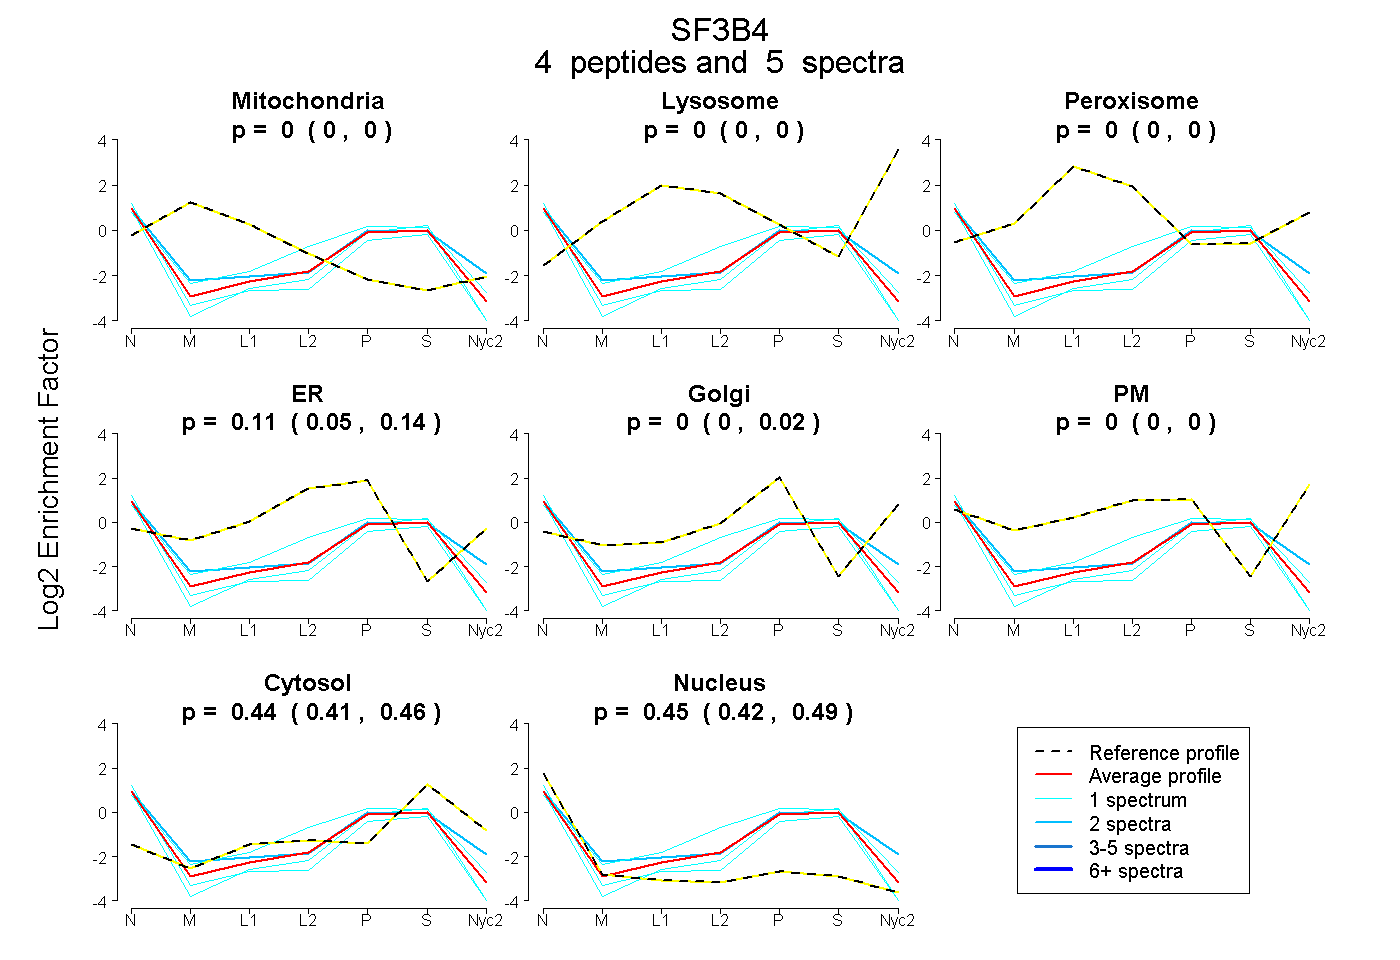
0.000 | 0.000
0.000 | 0.000
0.000 | 0.000
0.054 | 0.138
0.000 | 0.016
0.000 | 0.000
0.409 | 0.460
0.416 | 0.486
3peptides
spectra
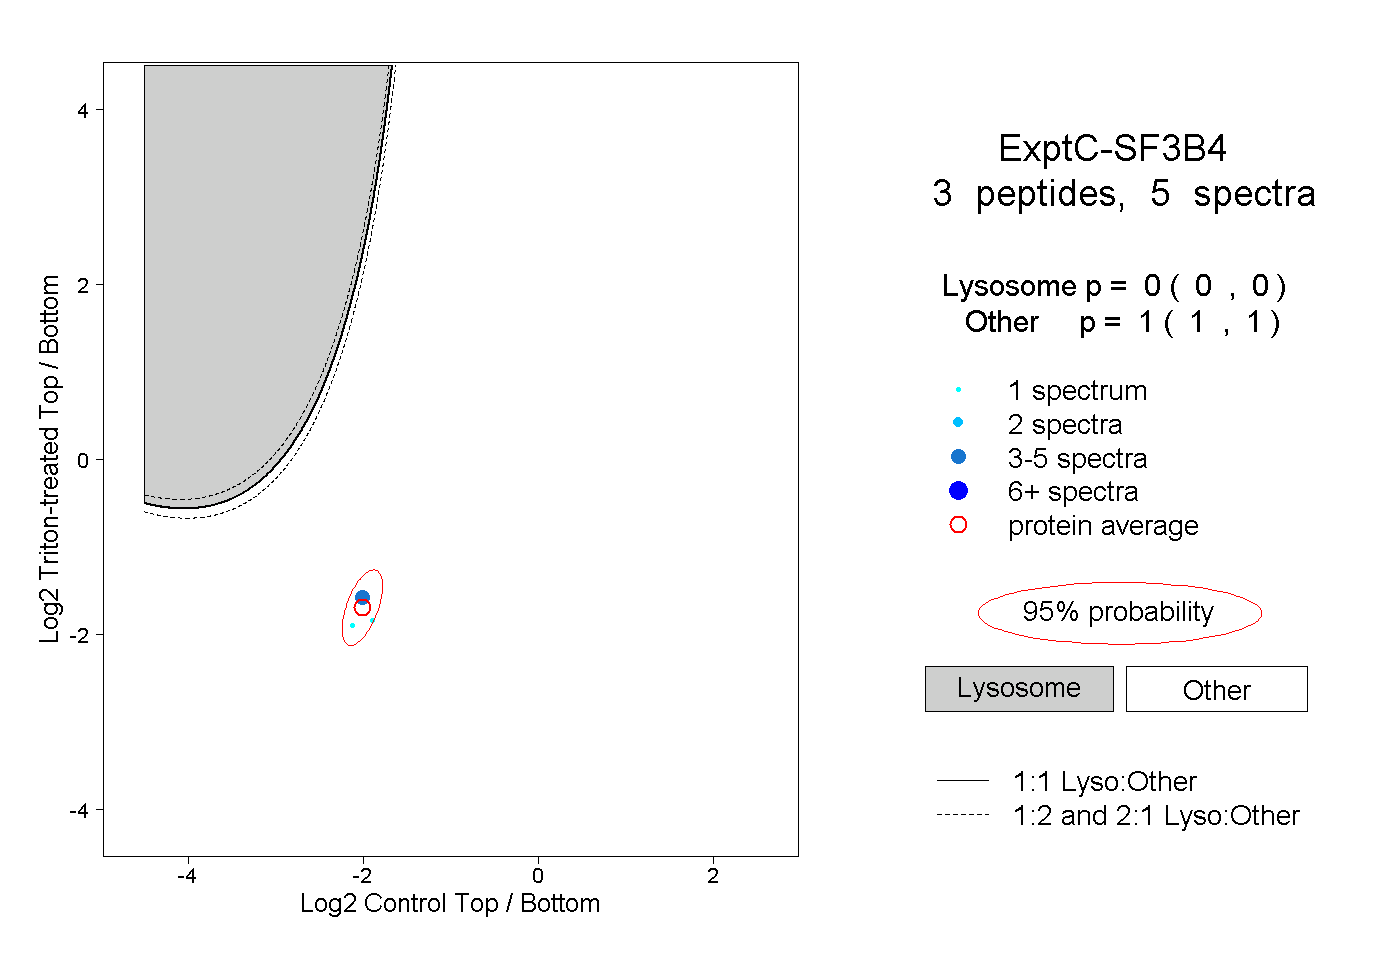
0.000 | 0.000
1.000 | 1.000
| Plot | Mito | Lyso | Perox | ER | Golgi | PM | Cytosol | Nucleus | |||||
| Expt A |
4 peptides |
5 spectra |
|
0.000 0.000 | 0.000 |
0.000 0.000 | 0.000 |
0.000 0.000 | 0.000 |
0.108 0.054 | 0.138 |
0.000 0.000 | 0.016 |
0.000 0.000 | 0.000 |
0.439 0.409 | 0.460 |
0.453 0.416 | 0.486 |
||
| Plot | Lyso | Other | |||||||||||
| Expt C |
3 peptides |
5 spectra |
|
0.000 0.000 | 0.000 |
1.000 1.000 | 1.000 |