12
12peptides
spectra
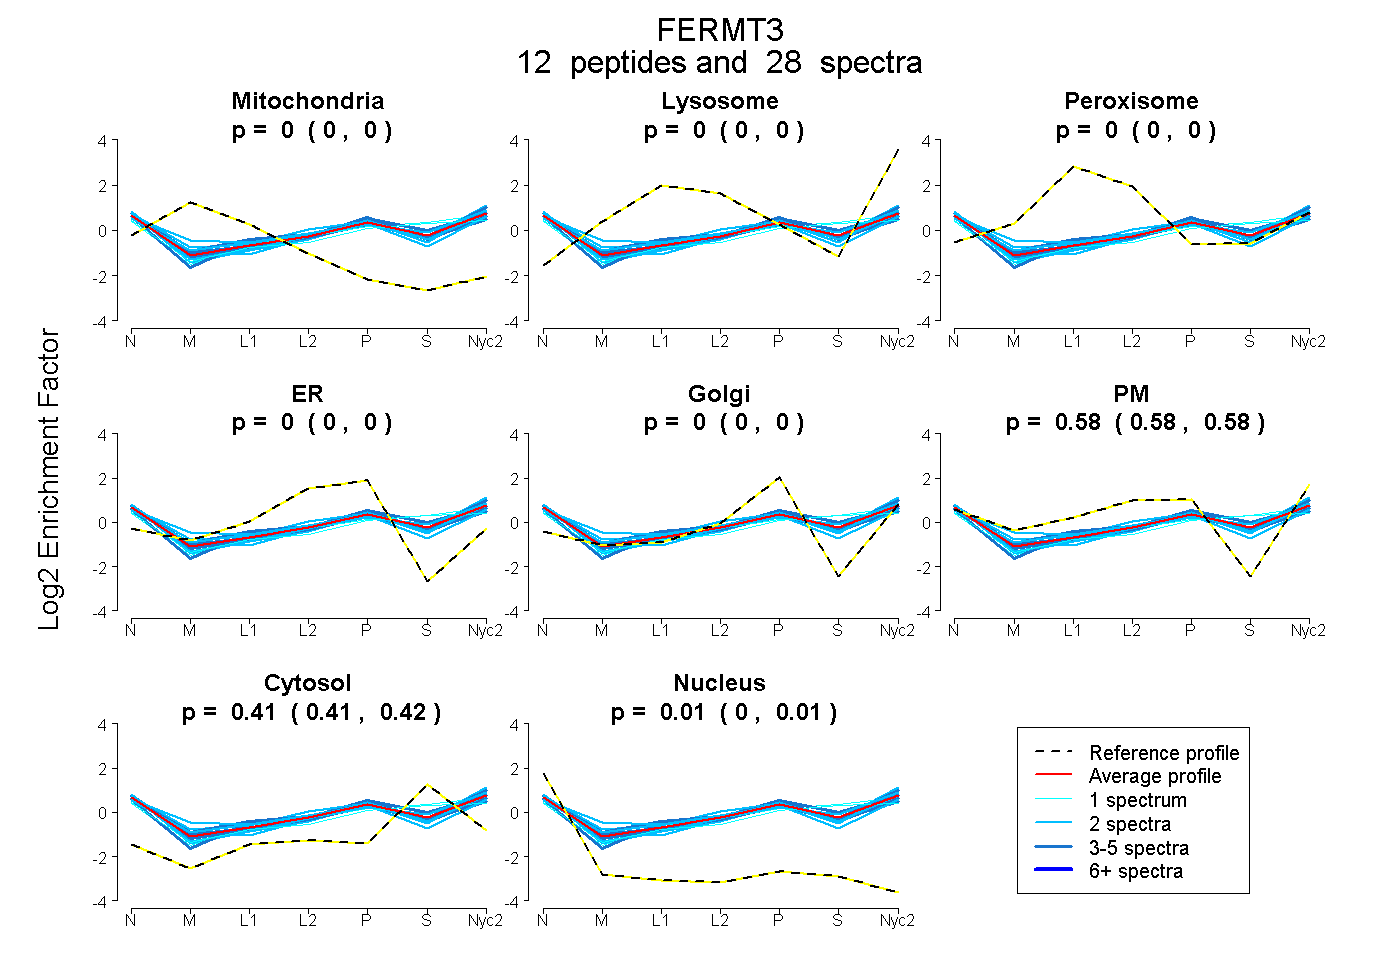
0.000 | 0.000
0.000 | 0.000
0.000 | 0.000
0.000 | 0.000
0.000 | 0.000
0.575 | 0.582
0.408 | 0.418
0.004 | 0.010
4peptides
spectra
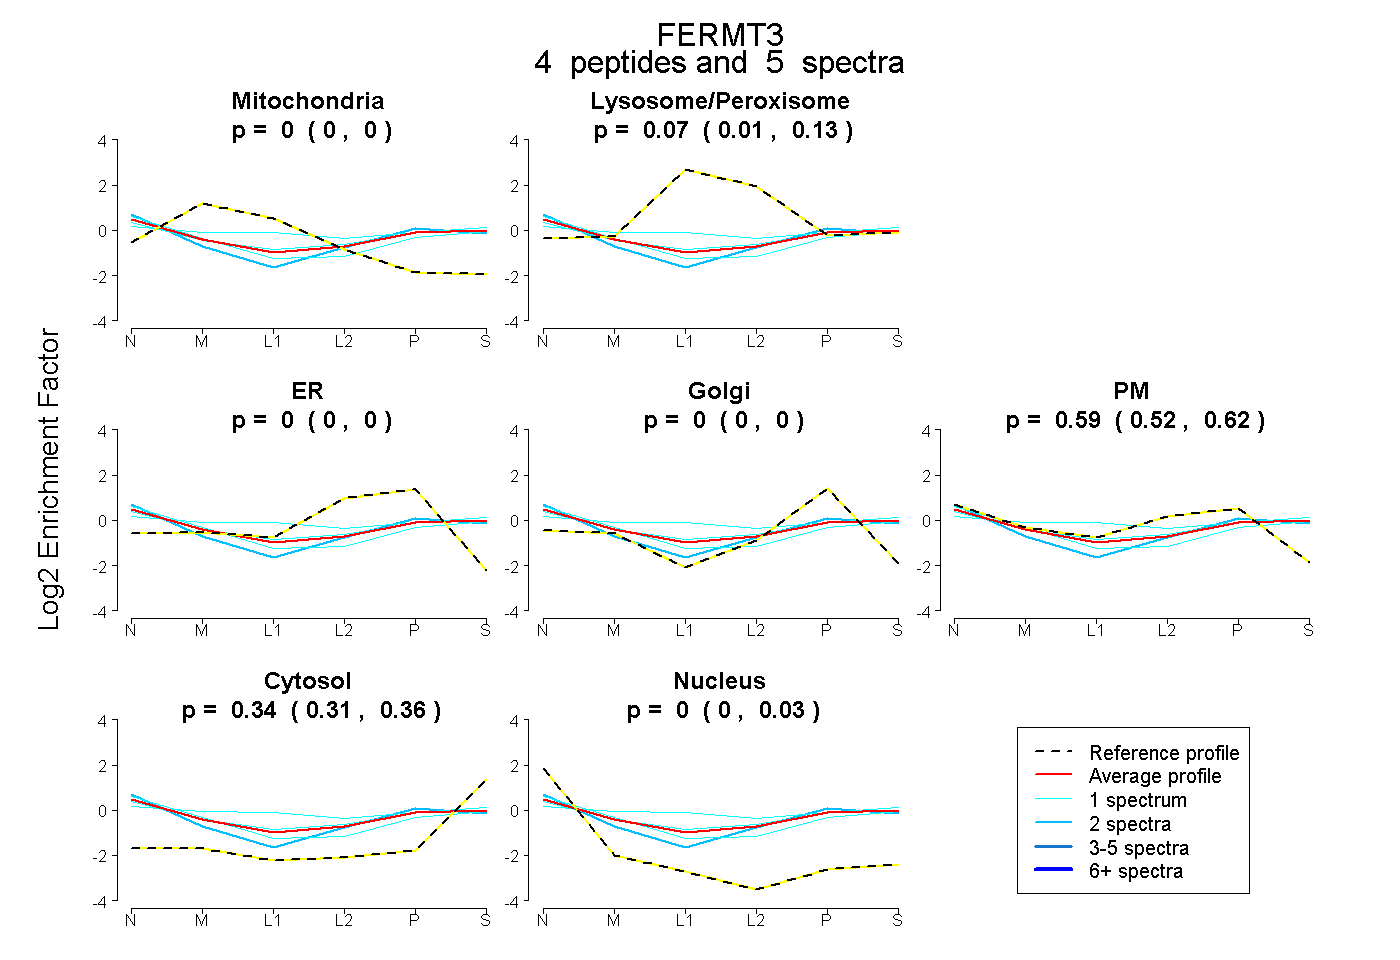
0.000 | 0.000
0.013 | 0.129
0.000 | 0.000
0.000 | 0.000
0.516 | 0.624
0.309 | 0.360
0.000 | 0.029
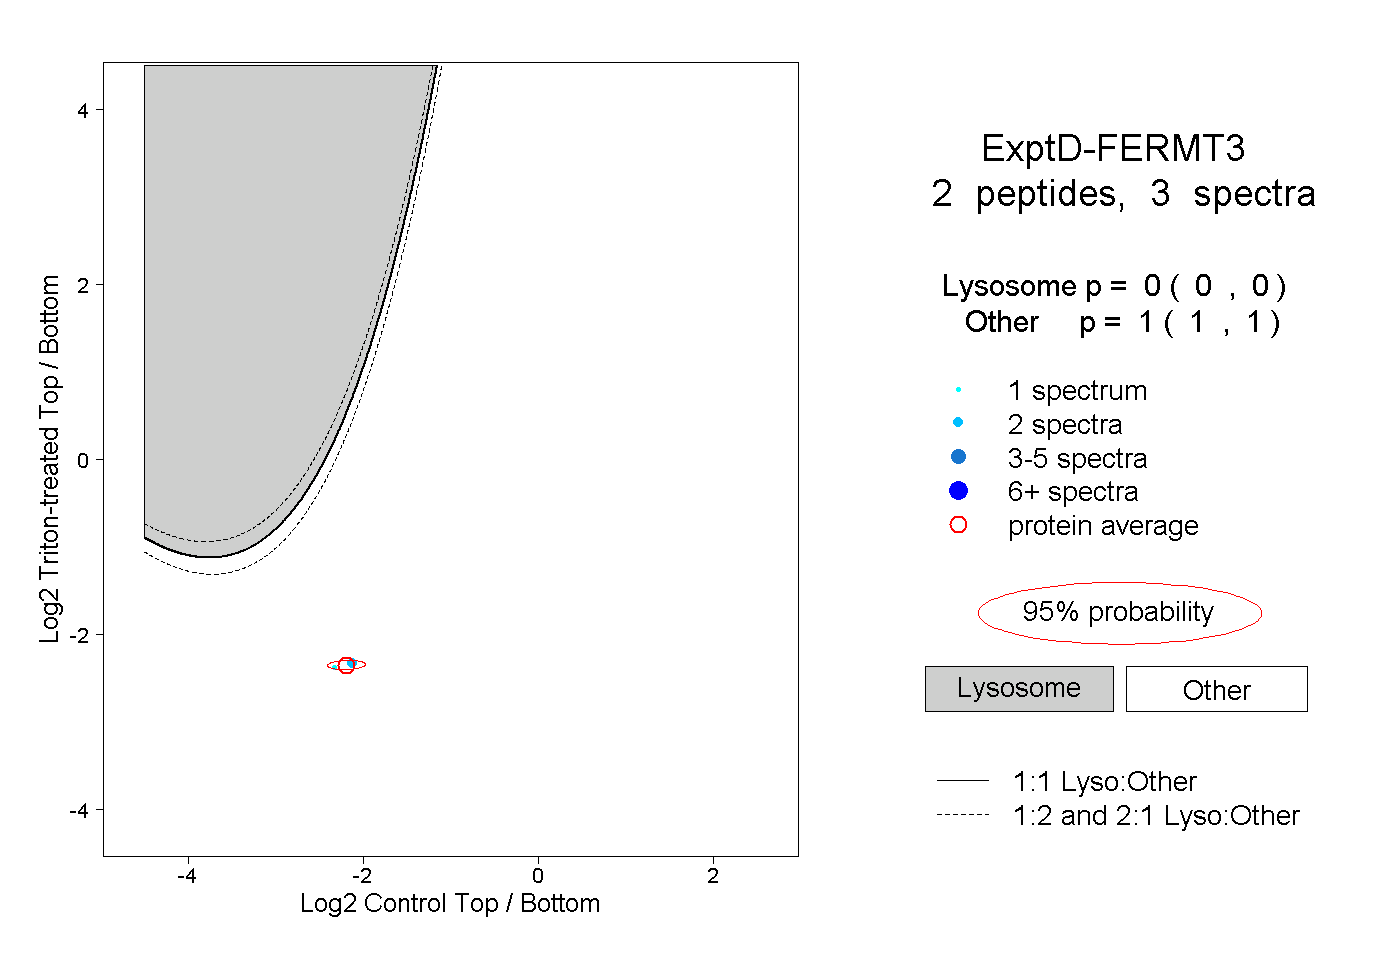
15peptides
spectra
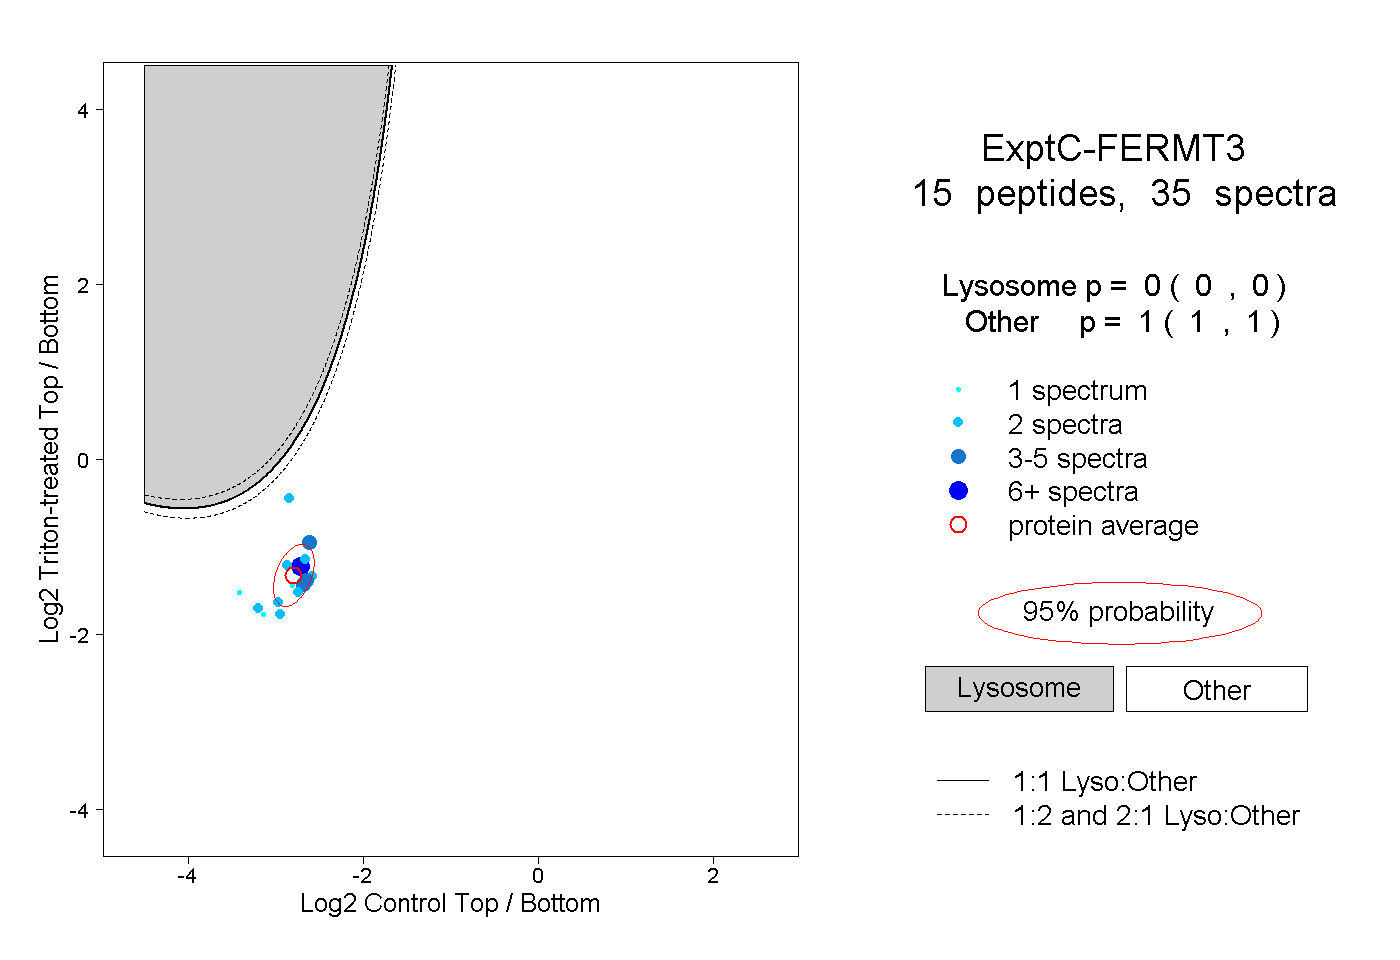
0.000 | 0.000
1.000 | 1.000