 12
12peptides
spectra
0.000 | 0.000
0.000 | 0.000
0.000 | 0.000
0.000 | 0.000
0.000 | 0.000
0.575 | 0.582
0.408 | 0.418
0.004 | 0.010
| Plot | Mito | Lyso | Perox | ER | Golgi | PM | Cytosol | Nucleus | |||||
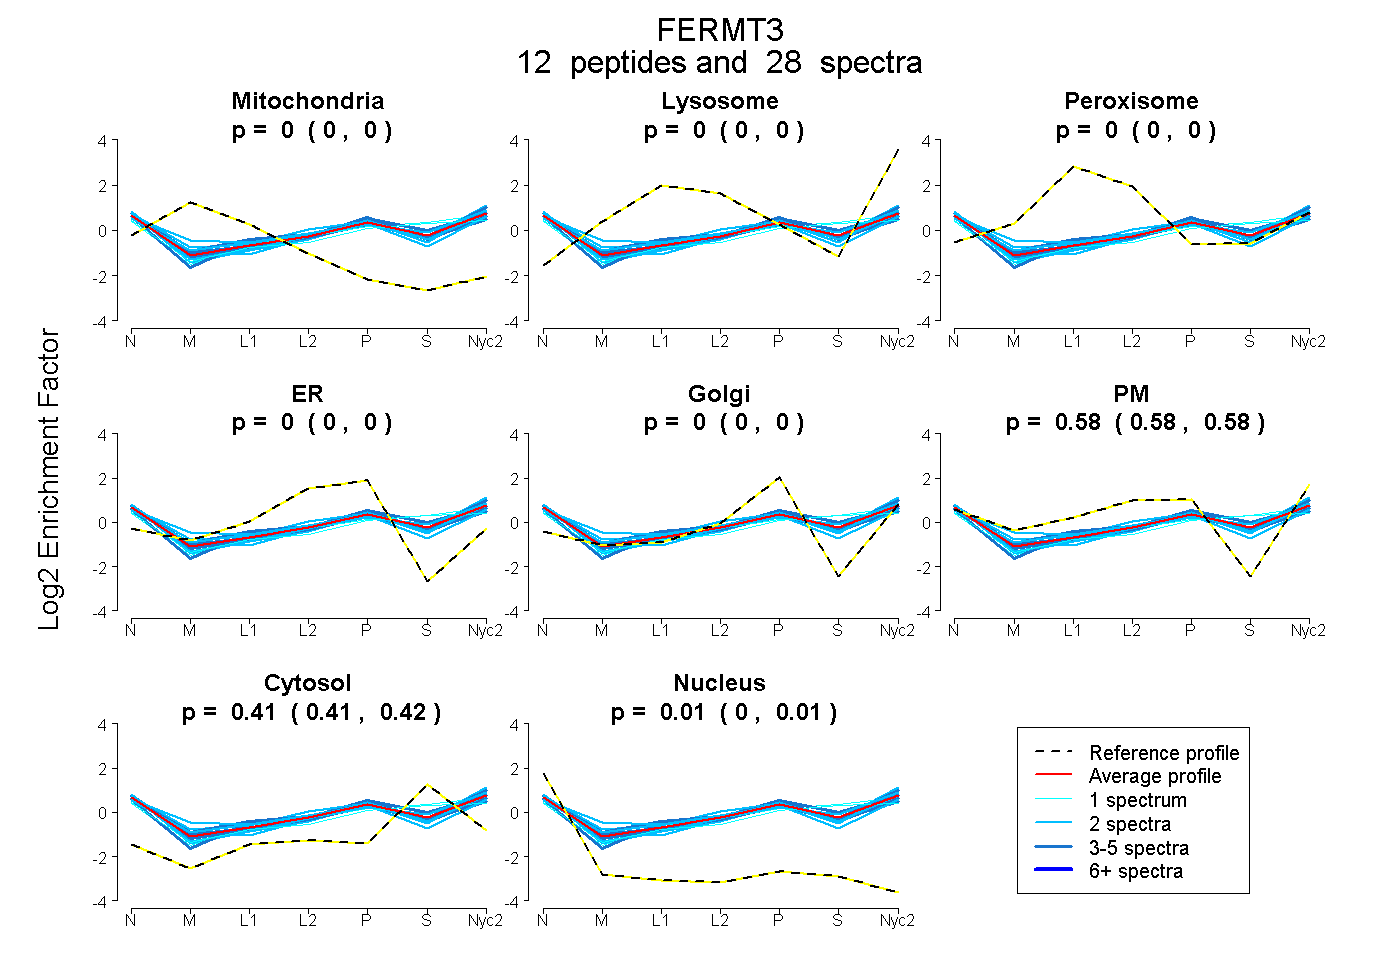
| Expt A |
12 peptides |
28 spectra |
|
0.000 0.000 | 0.000 |
0.000 0.000 | 0.000 |
0.000 0.000 | 0.000 |
0.000 0.000 | 0.000 |
0.000 0.000 | 0.000 |
0.579 0.575 | 0.582 |
0.414 0.408 | 0.418 |
0.007 0.004 | 0.010 |
| 1 spectrum, IDLAVGDVVK | 0.000 | 0.000 | 0.000 | 0.000 | 0.000 | 0.484 | 0.516 | 0.000 | ||
| 2 spectra, VVLAGGVAPTLFR | 0.000 | 0.000 | 0.000 | 0.000 | 0.000 | 0.583 | 0.376 | 0.041 | ||
| 2 spectra, VTGESHIGGVLLK | 0.051 | 0.000 | 0.000 | 0.000 | 0.000 | 0.622 | 0.309 | 0.018 | ||
| 4 spectra, QHWVIFK | 0.000 | 0.000 | 0.000 | 0.000 | 0.000 | 0.621 | 0.379 | 0.000 | ||
| 2 spectra, LTQLYEQAR | 0.000 | 0.000 | 0.000 | 0.000 | 0.000 | 0.662 | 0.338 | 0.000 | ||
| 3 spectra, LLVPSPEGMSEIYLR | 0.000 | 0.000 | 0.000 | 0.000 | 0.000 | 0.547 | 0.453 | 0.000 | ||
| 1 spectrum, YGILADAR | 0.000 | 0.000 | 0.000 | 0.000 | 0.000 | 0.454 | 0.546 | 0.000 | ||
| 2 spectra, VFVGEEDPEAQSVTLR | 0.000 | 0.000 | 0.000 | 0.000 | 0.000 | 0.578 | 0.422 | 0.000 | ||
| 3 spectra, ILEAHQNVAQLSLTEAQLR | 0.000 | 0.000 | 0.000 | 0.000 | 0.032 | 0.559 | 0.375 | 0.033 | ||
| 2 spectra, AGDVLWLR | 0.000 | 0.000 | 0.000 | 0.000 | 0.000 | 0.540 | 0.416 | 0.044 | ||
| 2 spectra, EPEEEVHDLTR | 0.000 | 0.000 | 0.000 | 0.000 | 0.005 | 0.596 | 0.393 | 0.006 | ||
| 4 spectra, HPEELSLLR | 0.000 | 0.000 | 0.000 | 0.000 | 0.000 | 0.564 | 0.391 | 0.045 |
| Plot | Mito | Lyso or Perox | ER | Golgi | PM | Cytosol | Nucleus | ||||||
| Expt B |
4 peptides |
5 spectra |
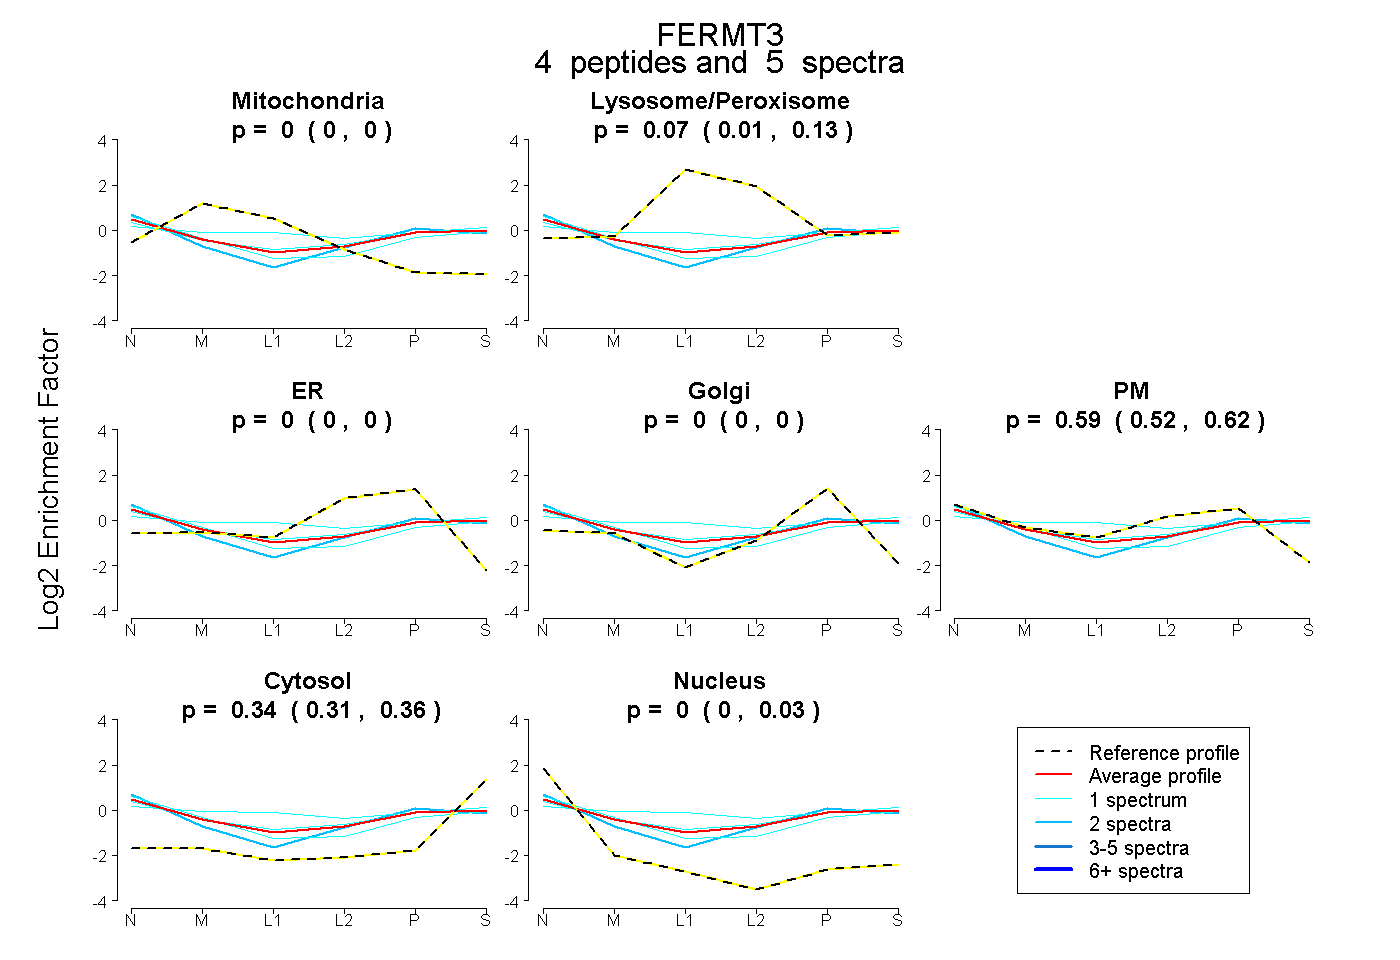 |
0.000 0.000 | 0.000 |
0.069 0.013 | 0.129 |
0.000 0.000 | 0.000 |
0.000 0.000 | 0.000 |
0.589 0.516 | 0.624 |
0.342 0.309 | 0.360 |
0.000 0.000 | 0.029 |
|||
| Plot | Lyso | Other | |||||||||||
| Expt C |
15 peptides |
35 spectra |
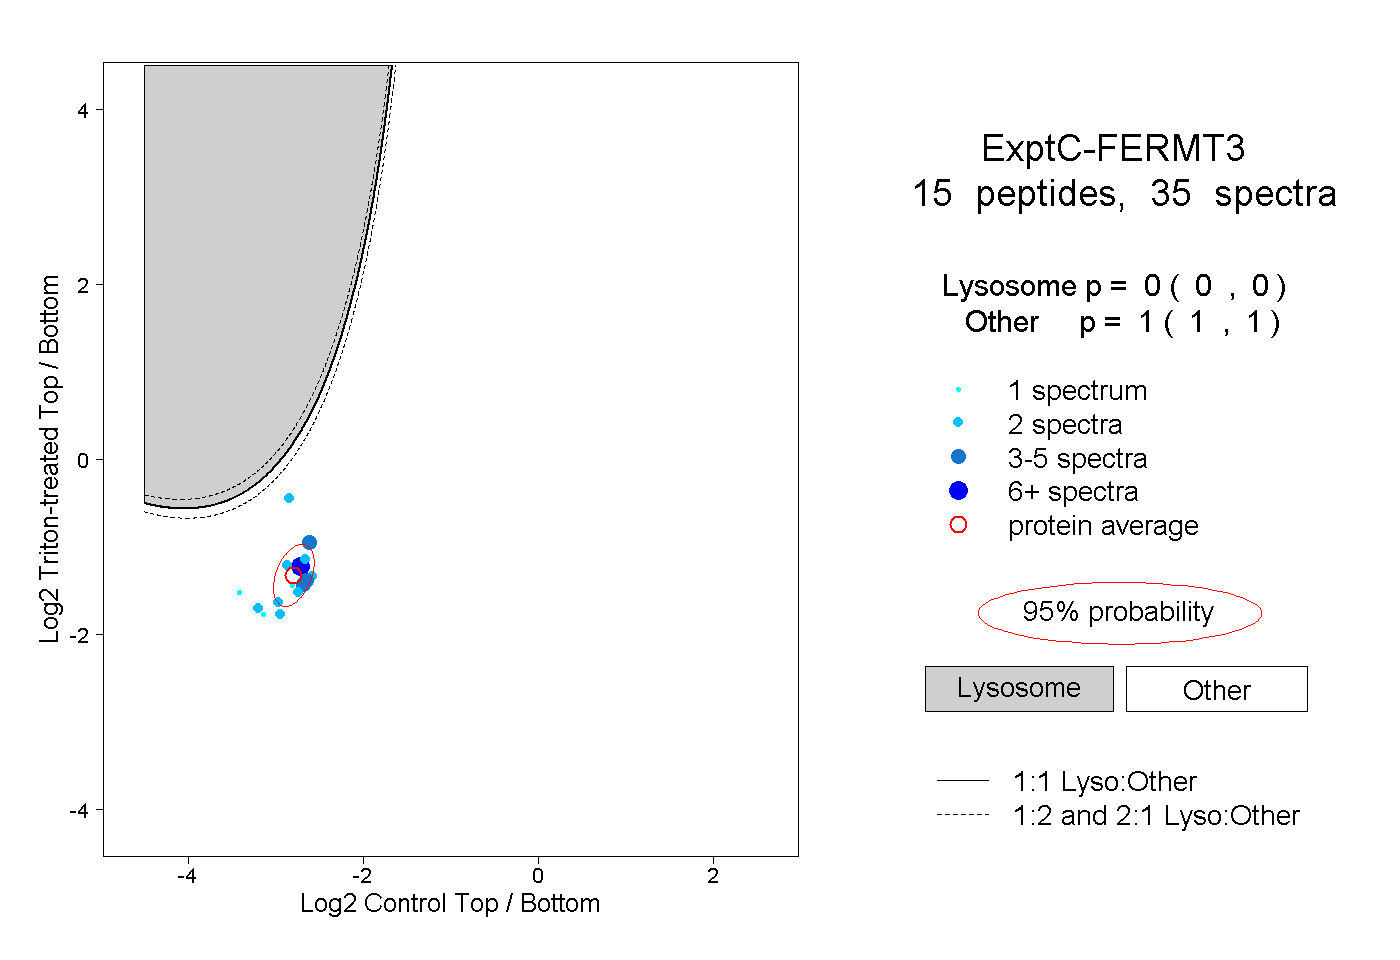 |
0.000 0.000 | 0.000 |
1.000 1.000 | 1.000 |
||||||||
| Plot | Lyso | Other | |||||||||||
| Expt D |
2 peptides |
3 spectra |
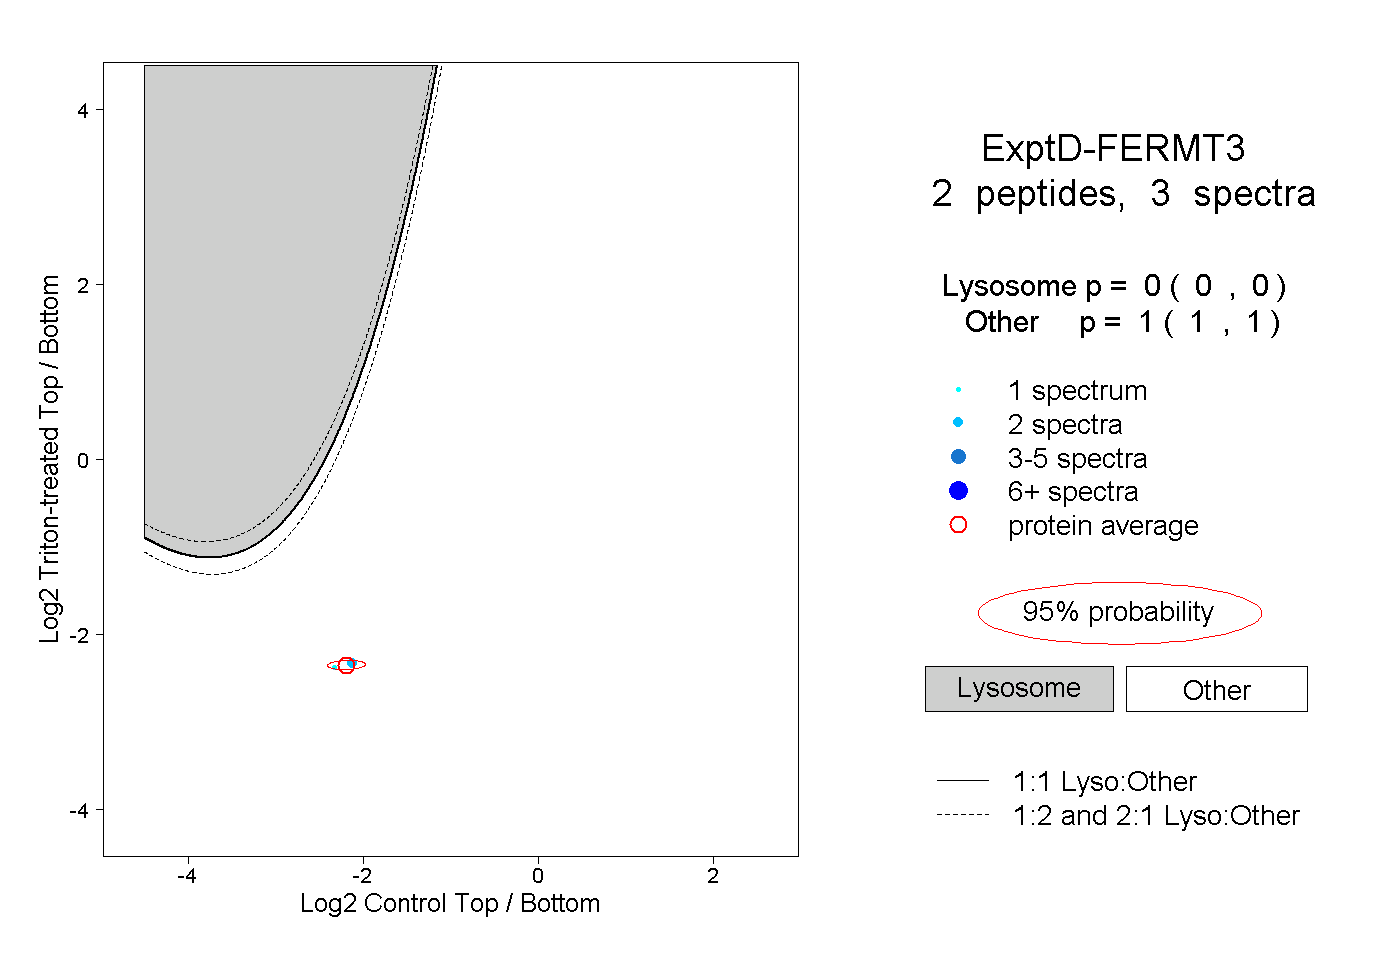 |
0.000 0.000 | 0.000 |
1.000 1.000 | 1.000 |