4
4peptides
spectra
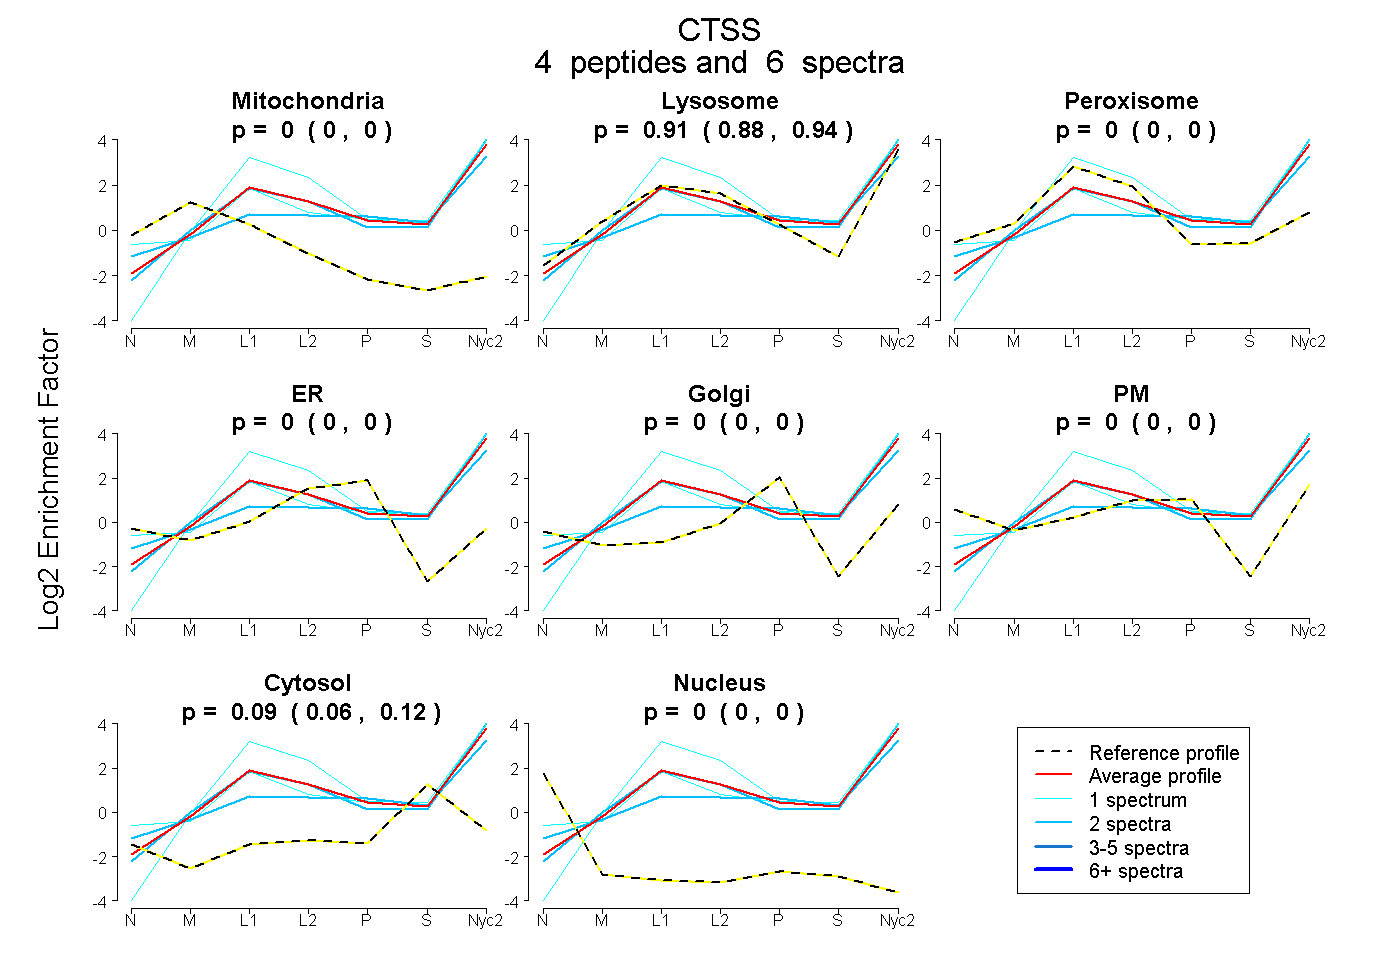
0.000 | 0.000
0.877 | 0.940
0.000 | 0.000
0.000 | 0.000
0.000 | 0.000
0.000 | 0.000
0.055 | 0.116
0.000 | 0.000
2peptides
spectra
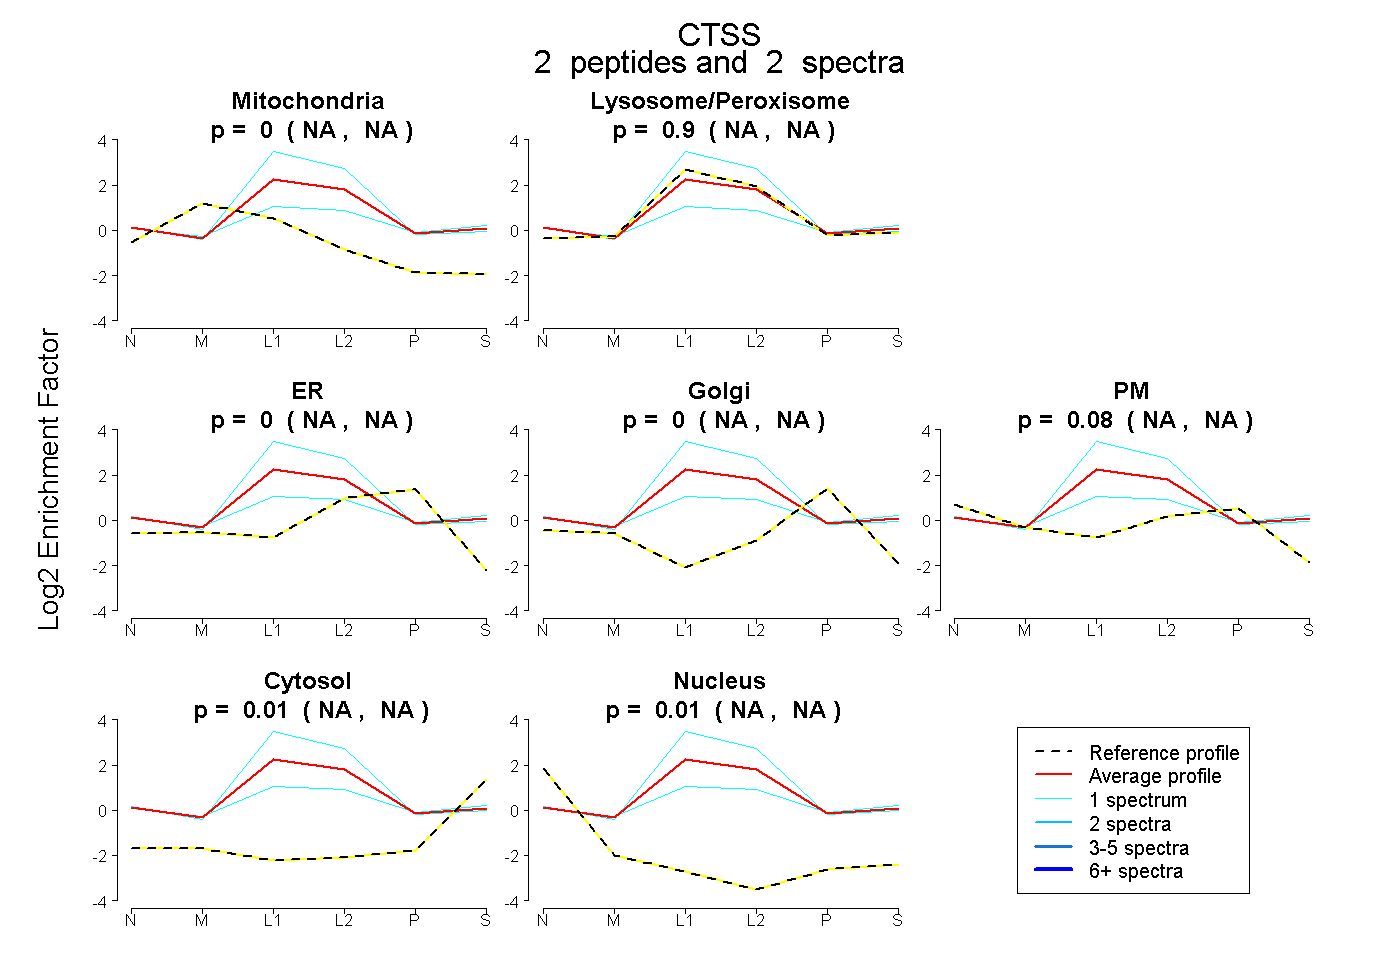
NA | NA
NA | NA
NA | NA
NA | NA
NA | NA
NA | NA
NA | NA
6peptides
spectra
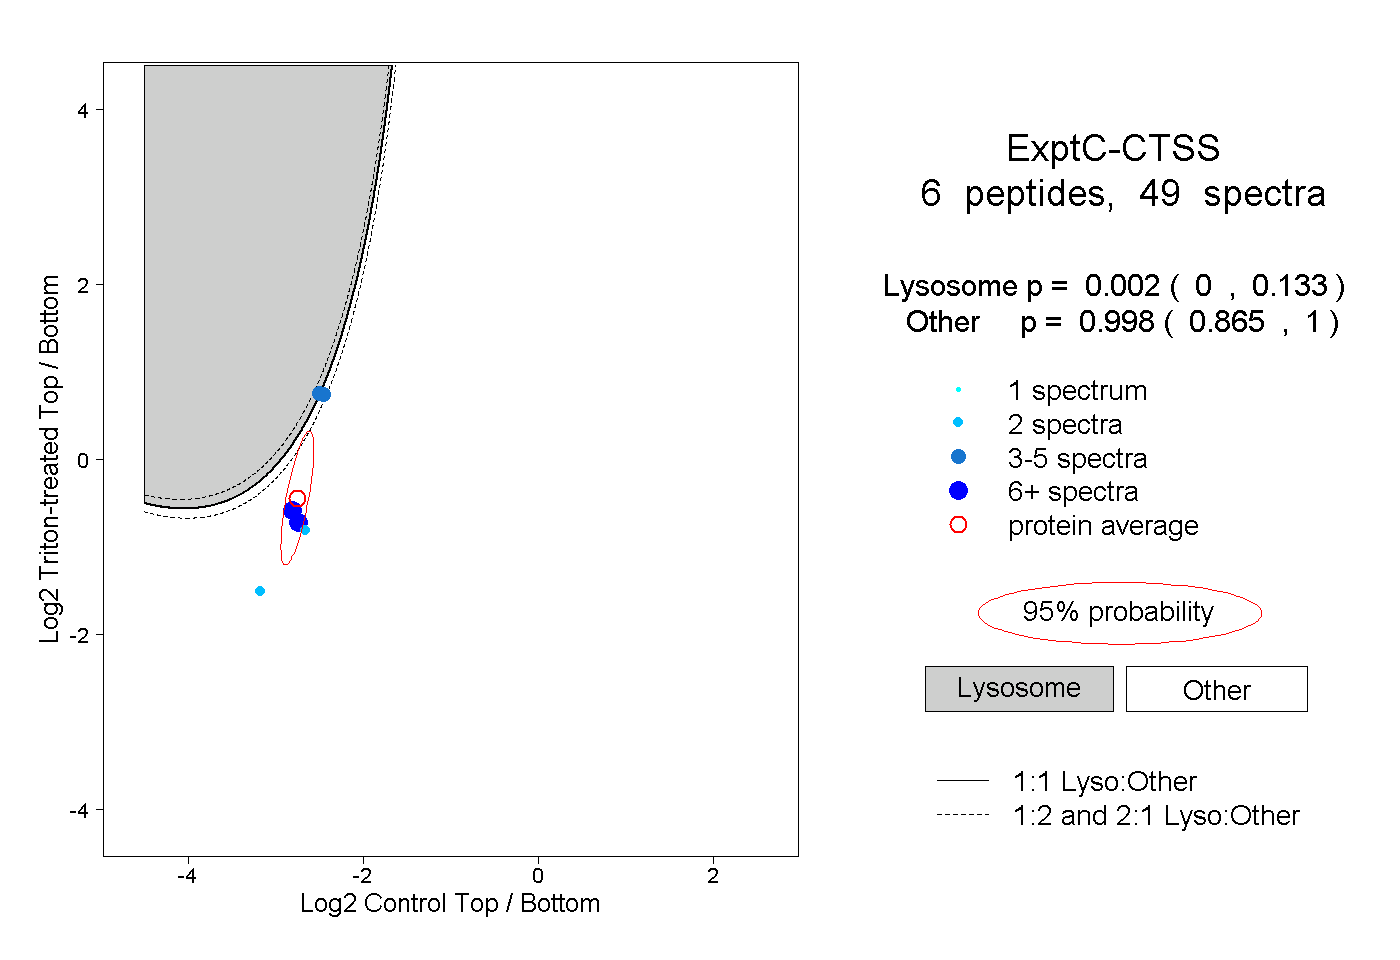
0.000 | 0.133
0.865 | 1.000