 5
5peptides
spectra
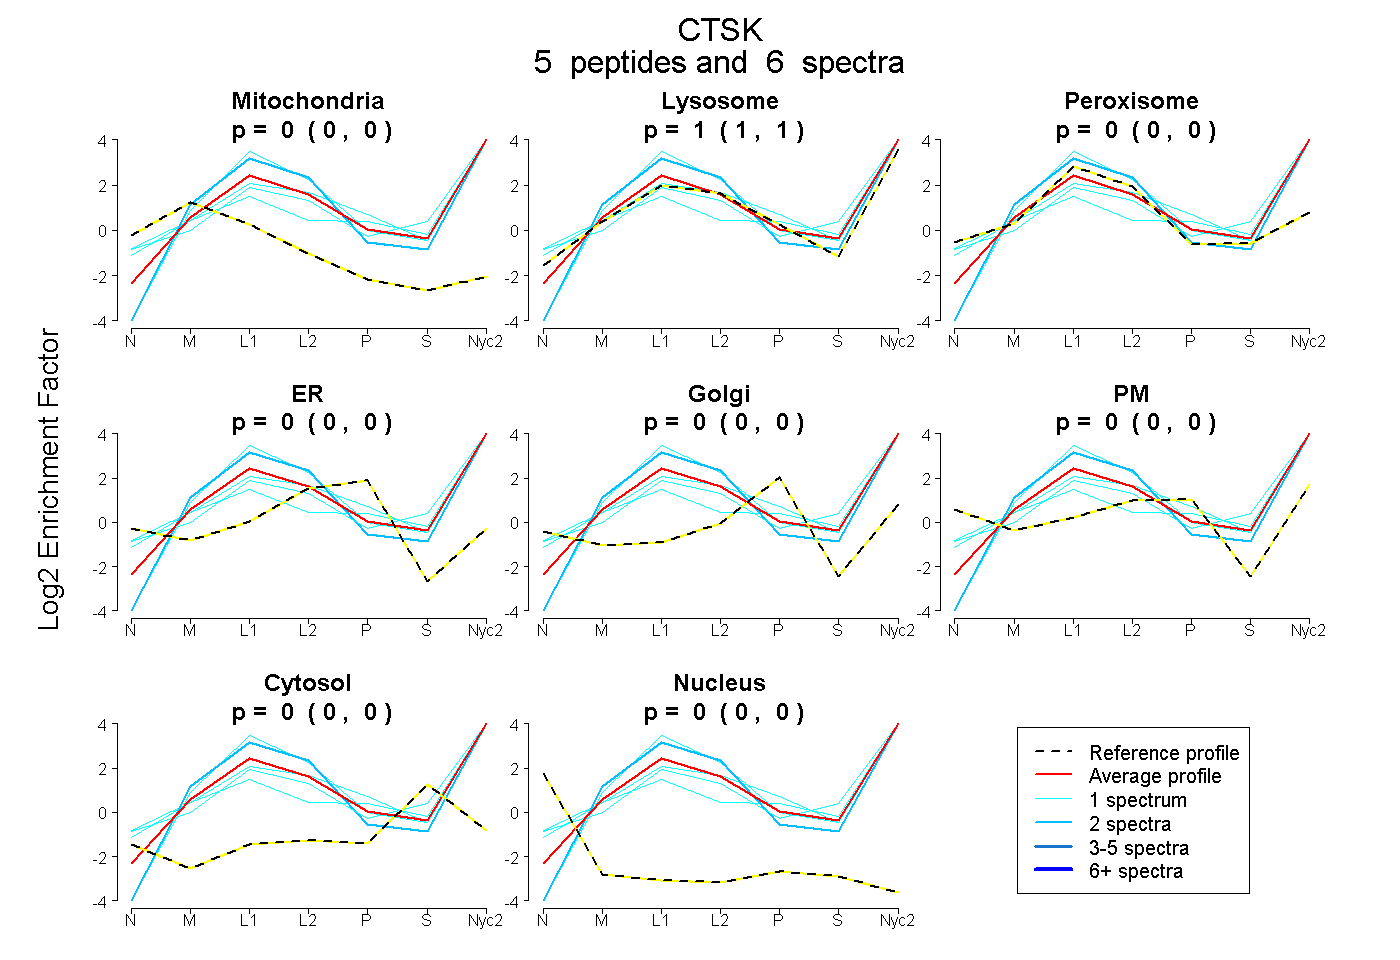
0.000 | 0.000
1.000 | 1.000
0.000 | 0.000
0.000 | 0.000
0.000 | 0.000
0.000 | 0.000
0.000 | 0.000
0.000 | 0.000
2peptides
spectra
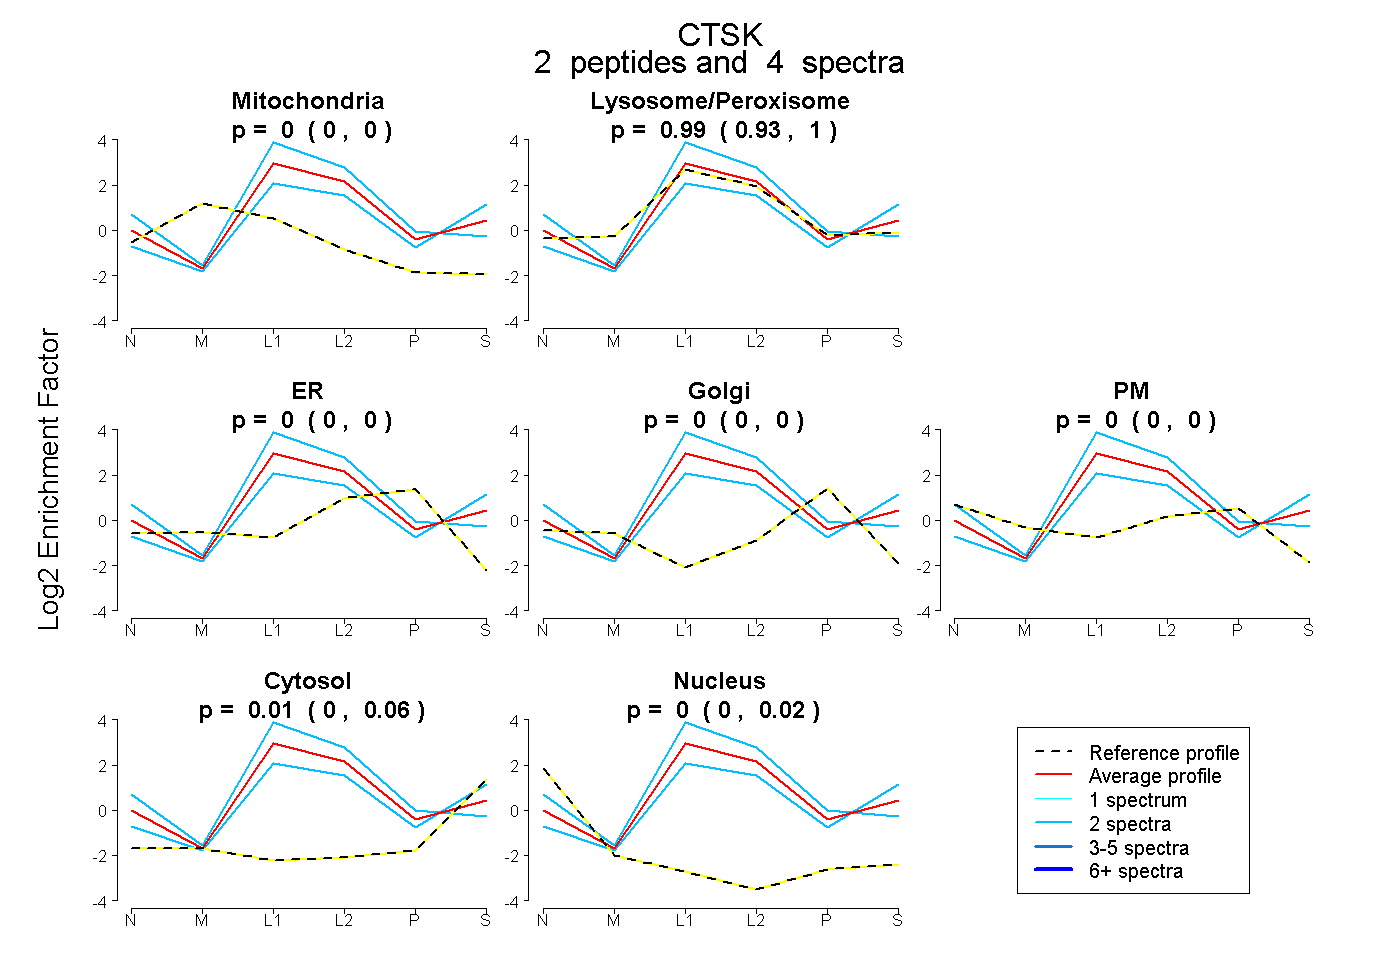
0.000 | 0.000
0.927 | 1.000
0.000 | 0.000
0.000 | 0.000
0.000 | 0.000
0.000 | 0.061
0.000 | 0.022
7peptides
spectra
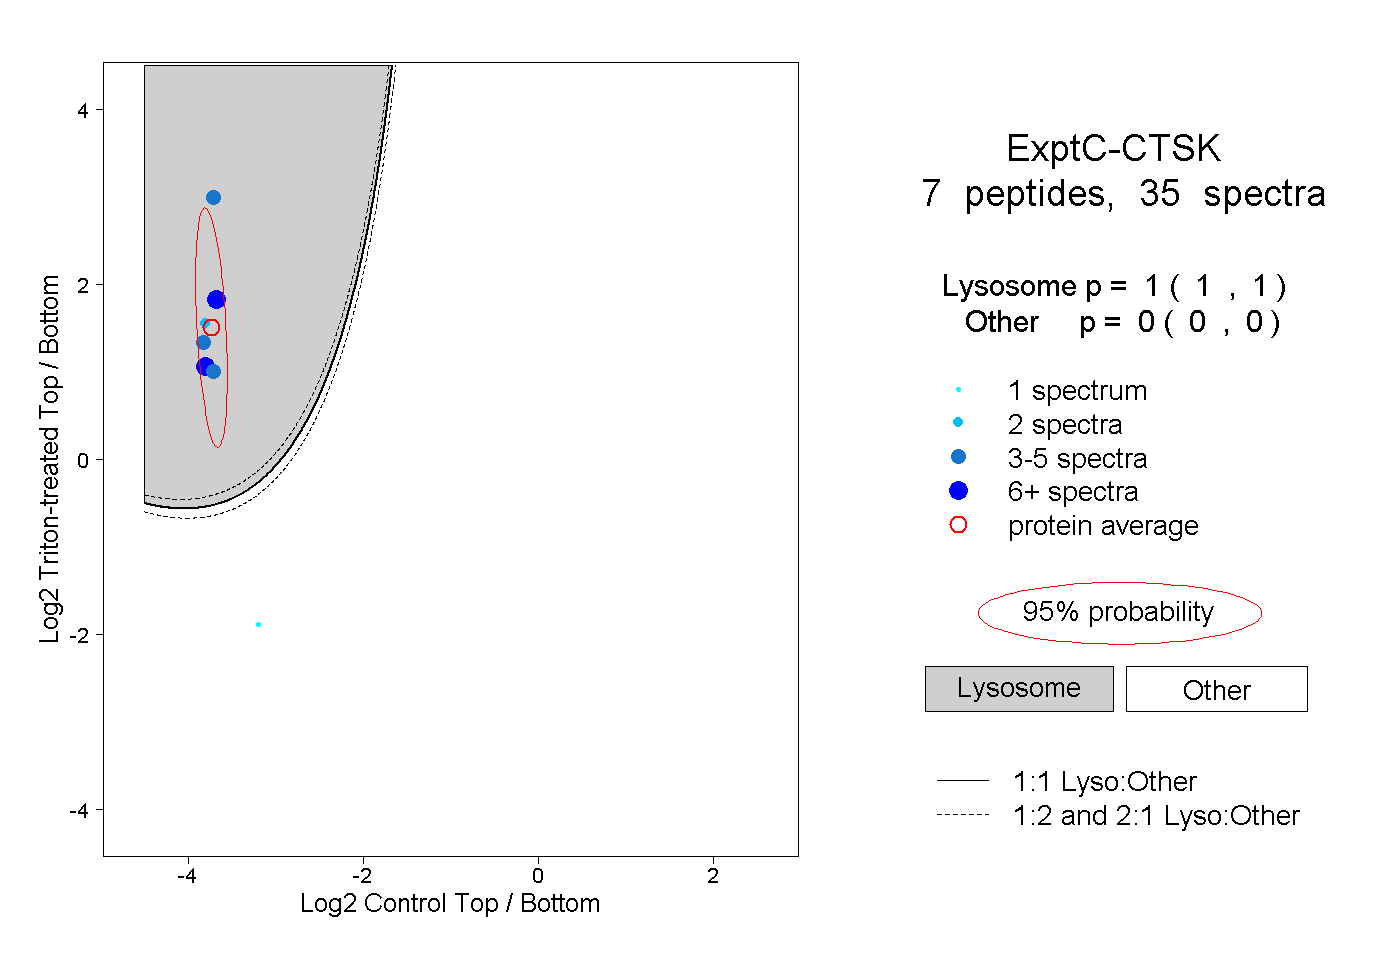
1.000 | 1.000
0.000 | 0.000
1peptide
spectra
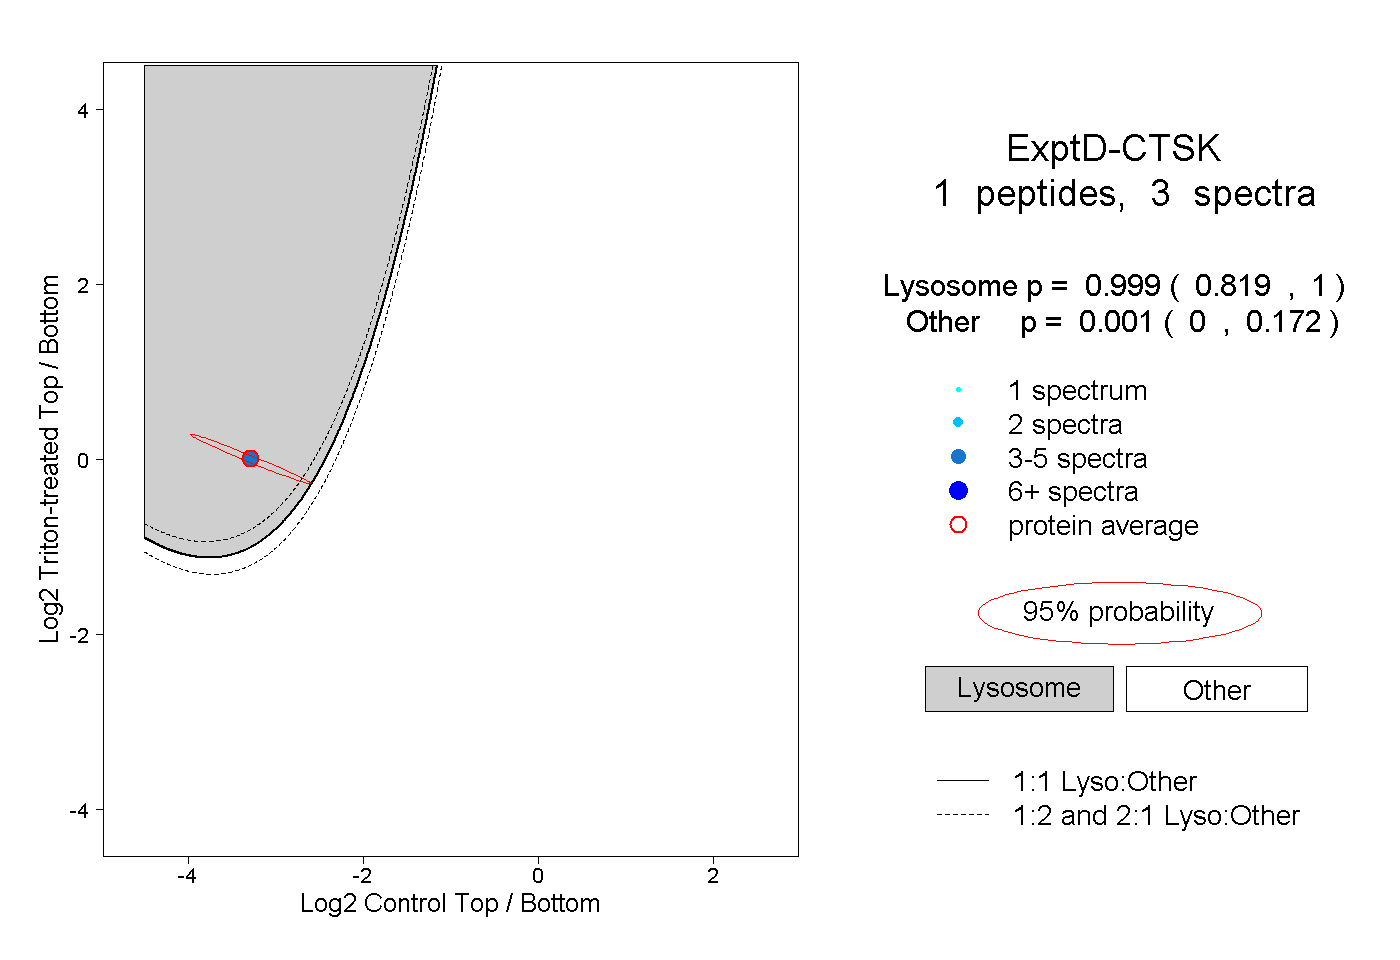
0.819 | 1.000
0.000 | 0.172