 3
3peptides
spectra
0.000 | 0.043
0.000 | 0.066
0.000 | 0.113
0.000 | 0.013
0.000 | 0.000
0.124 | 0.411
0.464 | 0.657
0.000 | 0.153
1peptide
spectrum
NA | NA
NA | NA
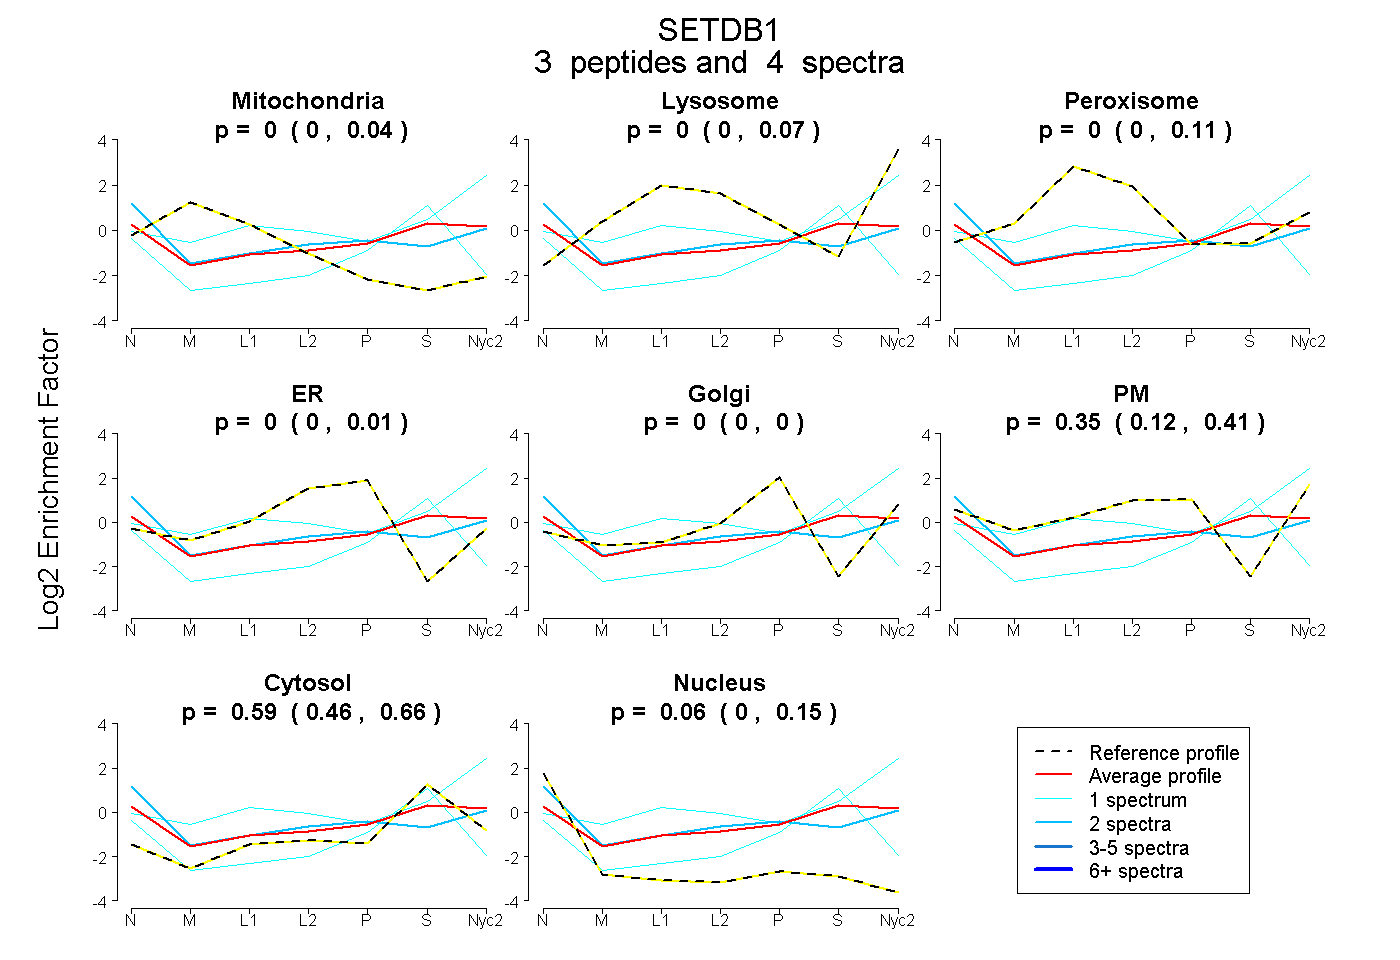
| Plot | Mito | Lyso | Perox | ER | Golgi | PM | Cytosol | Nucleus | |||||
| Expt A |
3 peptides |
4 spectra |
|
0.000 0.000 | 0.043 |
0.000 0.000 | 0.066 |
0.000 0.000 | 0.113 |
0.000 0.000 | 0.013 |
0.000 0.000 | 0.000 |
0.353 0.124 | 0.411 |
0.592 0.464 | 0.657 |
0.056 0.000 | 0.153 |
||
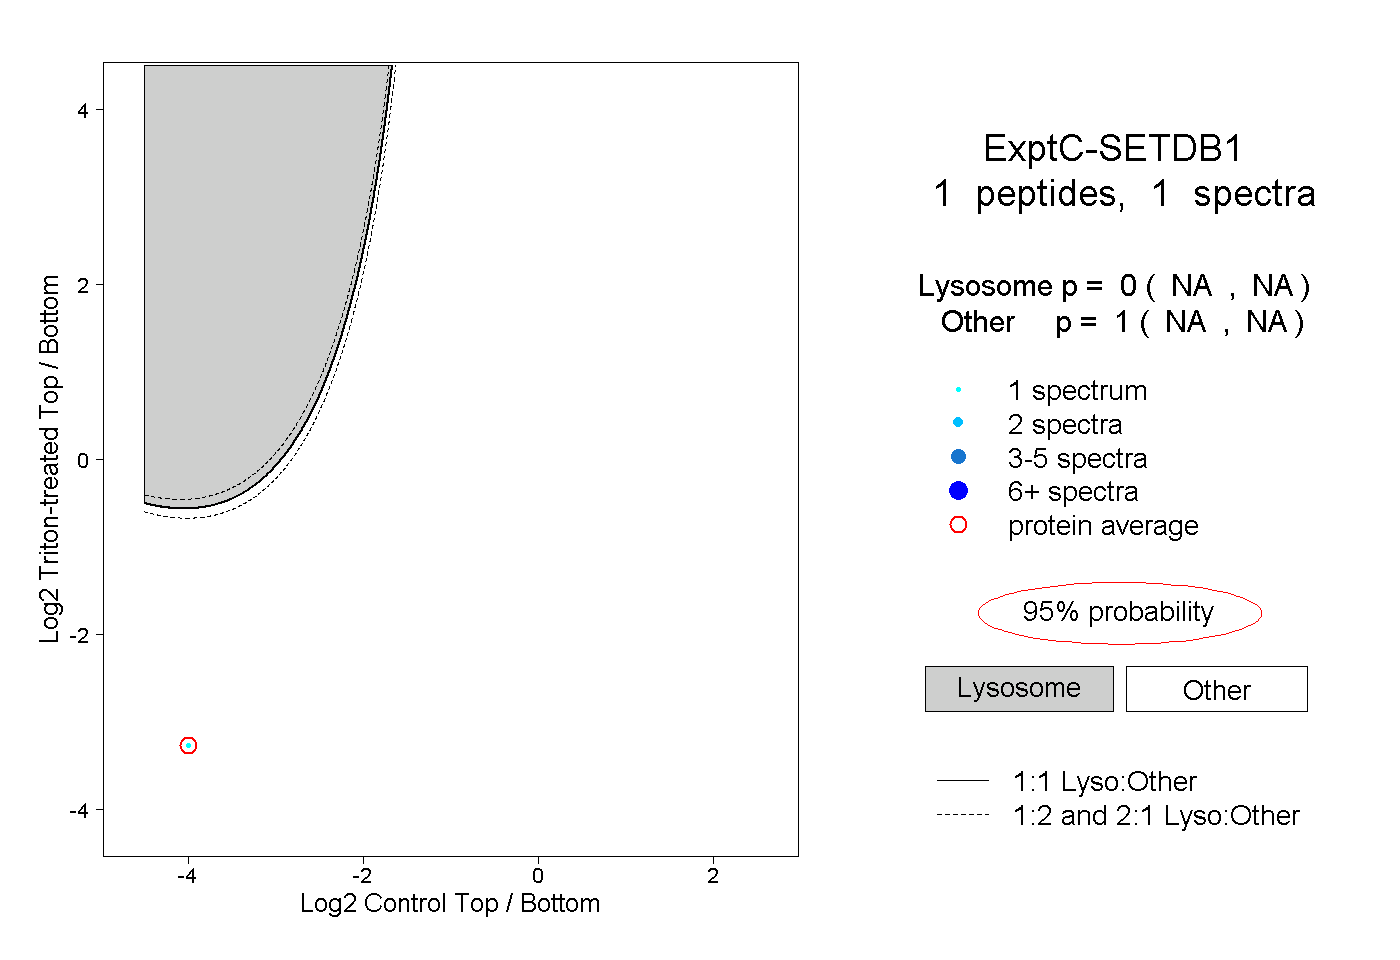
| Plot | Lyso | Other | |||||||||||
| Expt C |
1 peptide |
1 spectrum |
|
0.000 NA | NA |
1.000 NA | NA |