 5
5peptides
spectra
0.000 | 0.000
0.057 | 0.085
0.000 | 0.000
0.000 | 0.000
0.000 | 0.000
0.000 | 0.000
0.913 | 0.940
0.000 | 0.000
| Plot | Mito | Lyso | Perox | ER | Golgi | PM | Cytosol | Nucleus | |||||
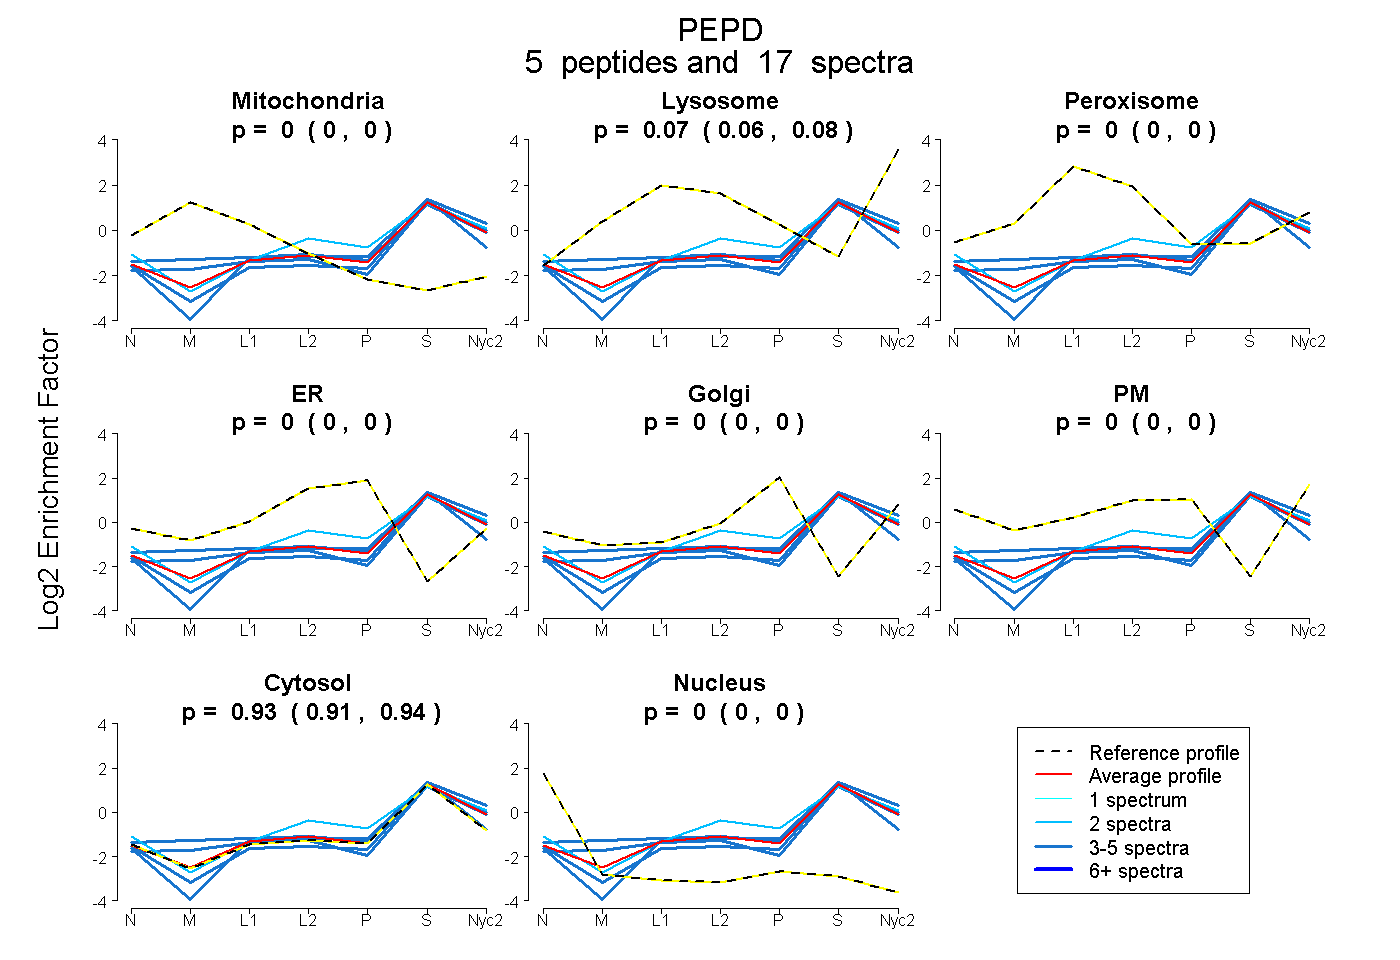
| Expt A |
5 peptides |
17 spectra |
|
0.000 0.000 | 0.000 |
0.073 0.057 | 0.085 |
0.000 0.000 | 0.000 |
0.000 0.000 | 0.000 |
0.000 0.000 | 0.000 |
0.000 0.000 | 0.000 |
0.927 0.913 | 0.940 |
0.000 0.000 | 0.000 |
| 3 spectra, AIYEAVLR | 0.000 | 0.036 | 0.000 | 0.000 | 0.000 | 0.000 | 0.964 | 0.000 | ||
| 3 spectra, ALAPSGPK | 0.000 | 0.000 | 0.000 | 0.000 | 0.000 | 0.000 | 0.992 | 0.008 | ||
| 2 spectra, TVEEIEACMAGCDK | 0.000 | 0.077 | 0.000 | 0.000 | 0.000 | 0.082 | 0.842 | 0.000 | ||
| 4 spectra, FTDDQK | 0.060 | 0.133 | 0.000 | 0.000 | 0.000 | 0.000 | 0.808 | 0.000 | ||
| 5 spectra, IHLEELTR | 0.015 | 0.092 | 0.000 | 0.000 | 0.000 | 0.000 | 0.893 | 0.000 |
| Plot | Mito | Lyso or Perox | ER | Golgi | PM | Cytosol | Nucleus | ||||||
| Expt B |
3 peptides |
13 spectra |
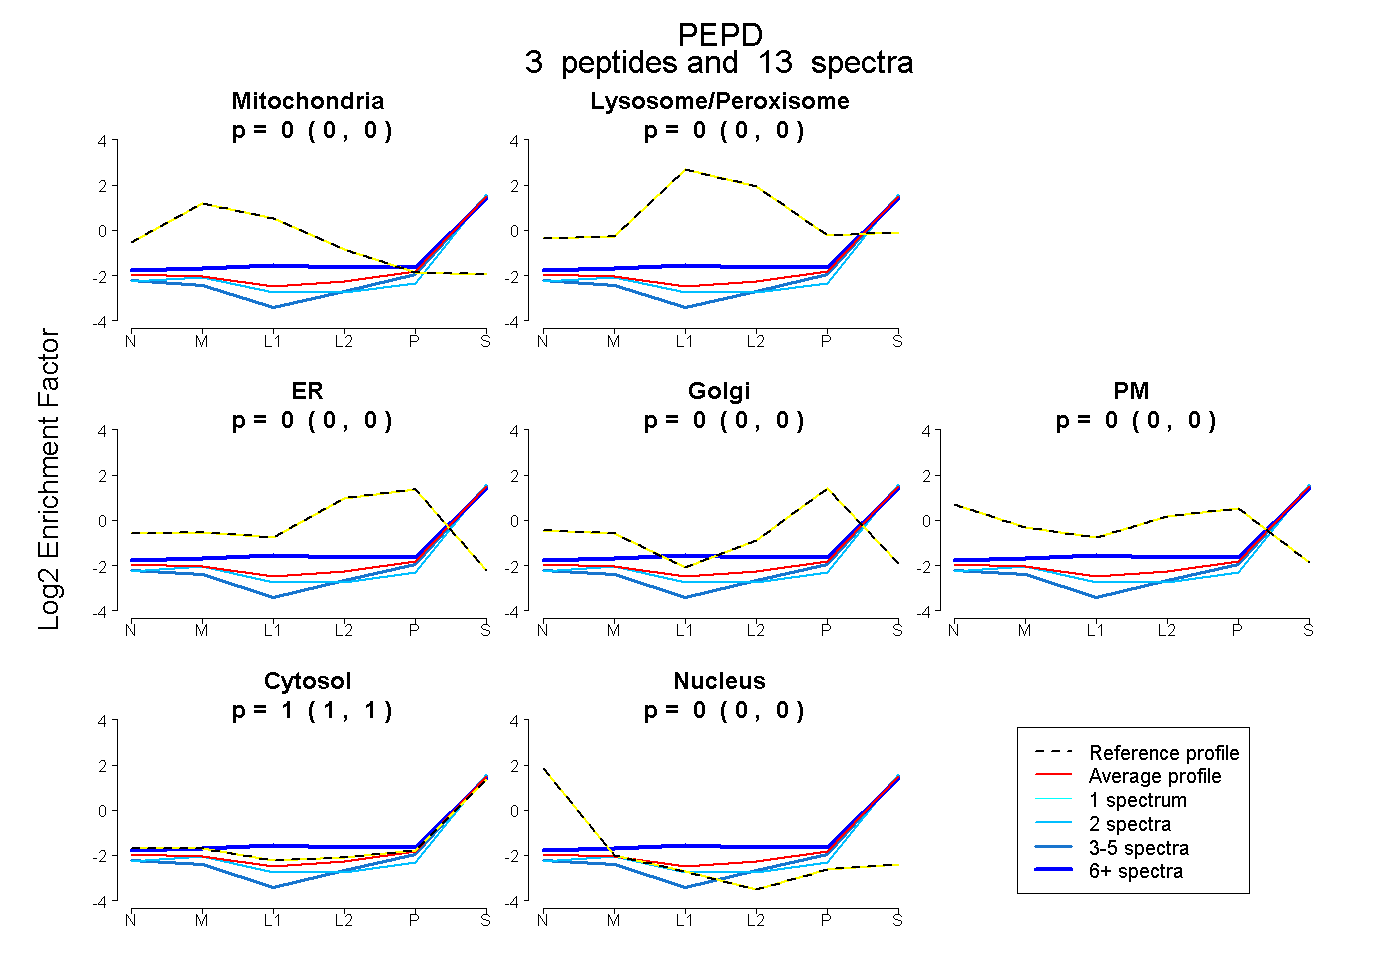 |
0.000 0.000 | 0.000 |
0.000 0.000 | 0.000 |
0.000 0.000 | 0.000 |
0.000 0.000 | 0.000 |
0.000 0.000 | 0.000 |
1.000 1.000 | 1.000 |
0.000 0.000 | 0.000 |
|||
| Plot | Lyso | Other | |||||||||||
| Expt C |
5 peptides |
13 spectra |
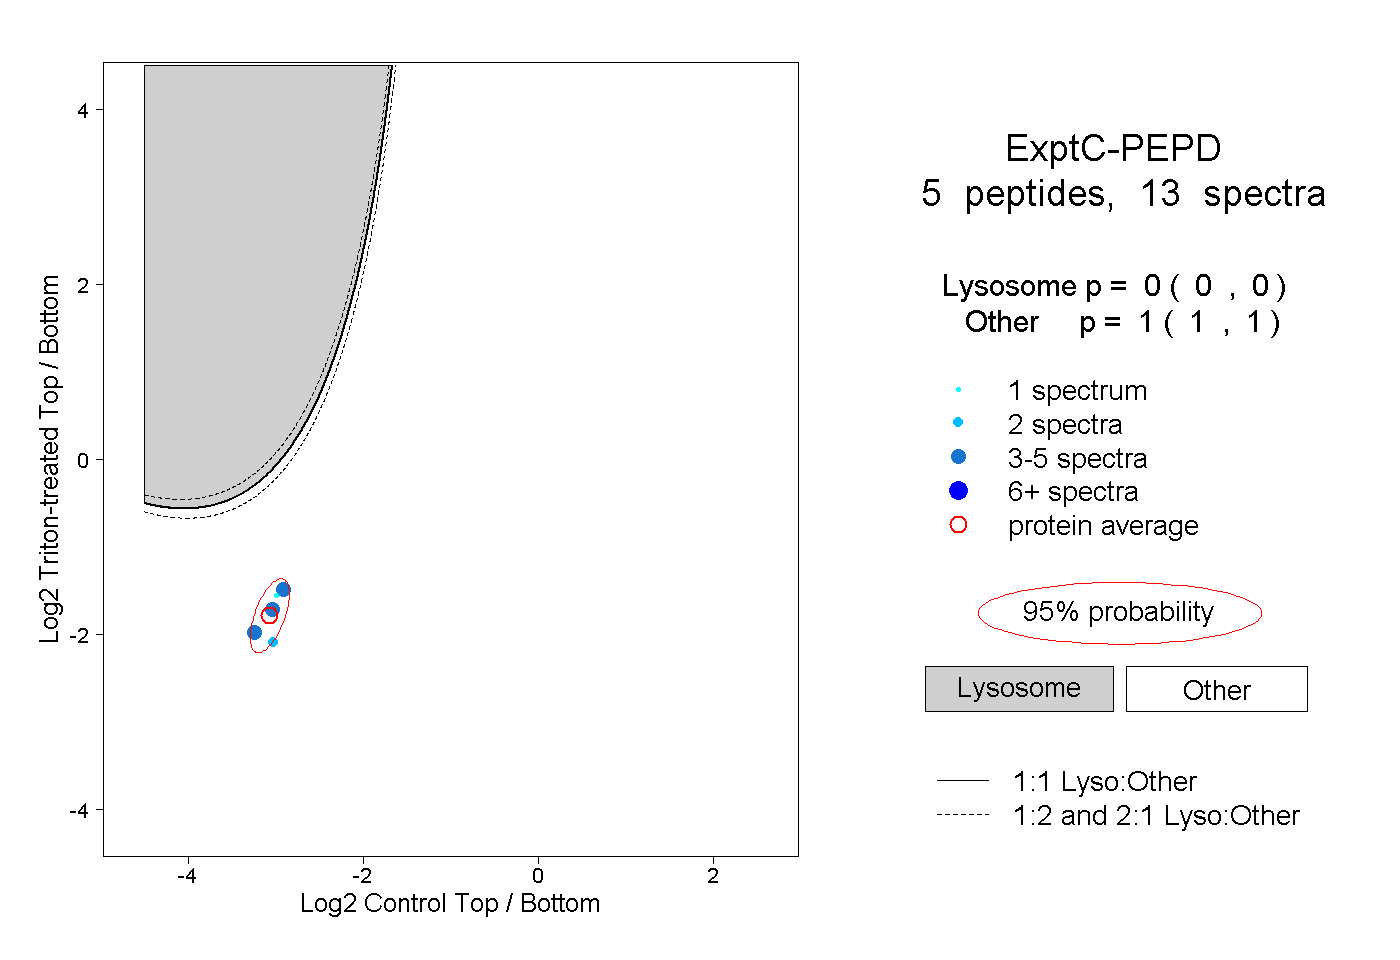 |
0.000 0.000 | 0.000 |
1.000 1.000 | 1.000 |
||||||||
| Plot | Lyso | Other | |||||||||||
| Expt D |
1 peptide |
1 spectrum |
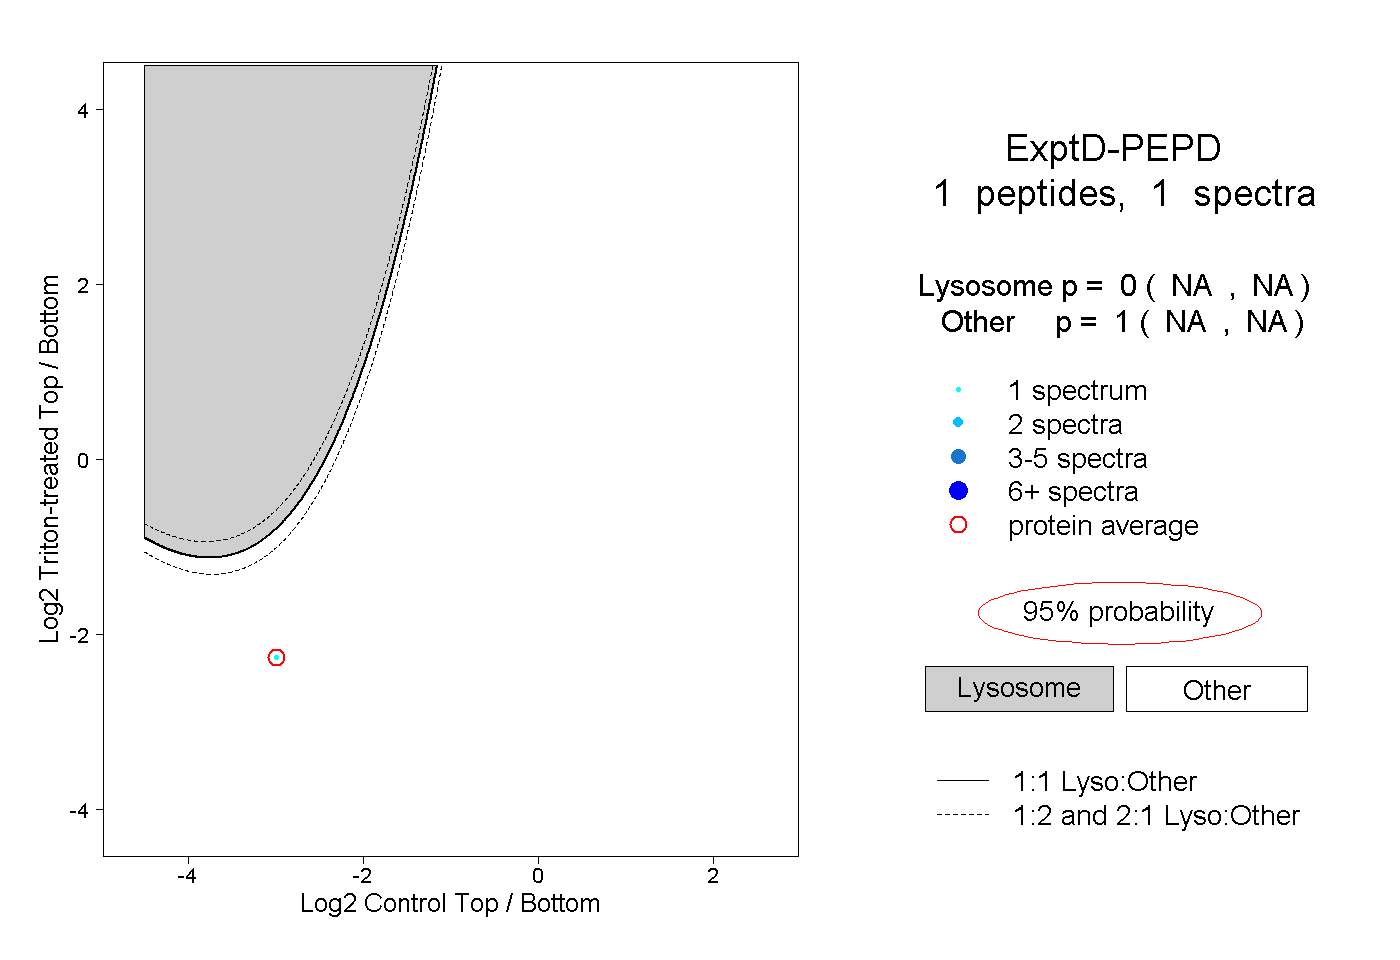 |
0.000 NA | NA |
1.000 NA | NA |