 2
2peptides
spectra
0.000 | 0.042
0.000 | 0.000
0.013 | 0.090
0.000 | 0.102
0.000 | 0.000
0.116 | 0.216
0.622 | 0.674
0.026 | 0.081
2peptides
spectra
0.000 | 0.000
1.000 | 1.000
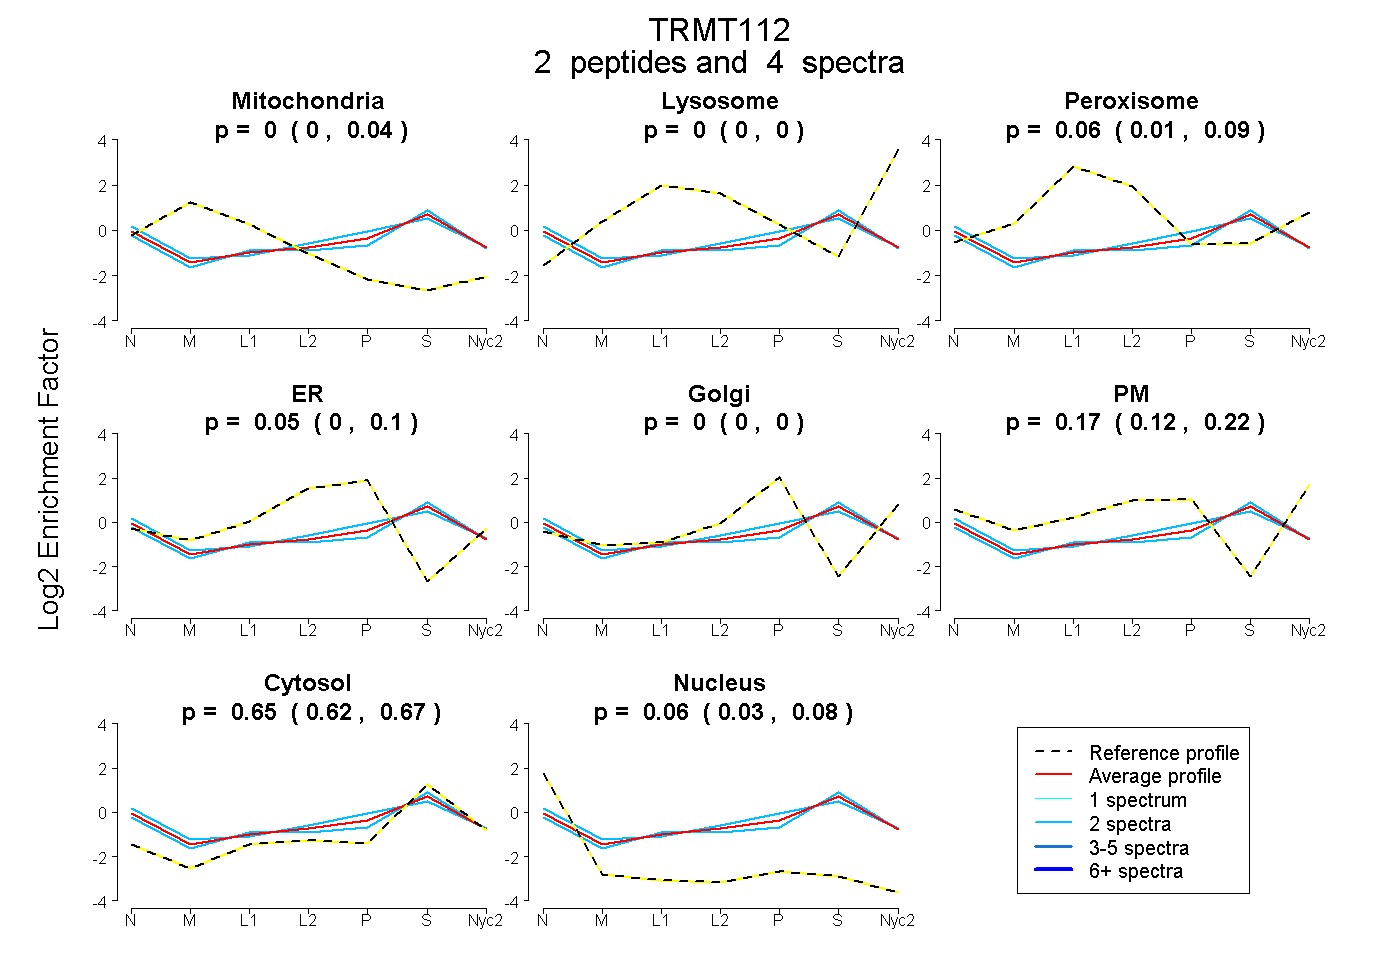
| Plot | Mito | Lyso | Perox | ER | Golgi | PM | Cytosol | Nucleus | |||||
| Expt A |
2 peptides |
4 spectra |
|
0.000 0.000 | 0.042 |
0.000 0.000 | 0.000 |
0.064 0.013 | 0.090 |
0.053 0.000 | 0.102 |
0.000 0.000 | 0.000 |
0.171 0.116 | 0.216 |
0.648 0.622 | 0.674 |
0.065 0.026 | 0.081 |
||
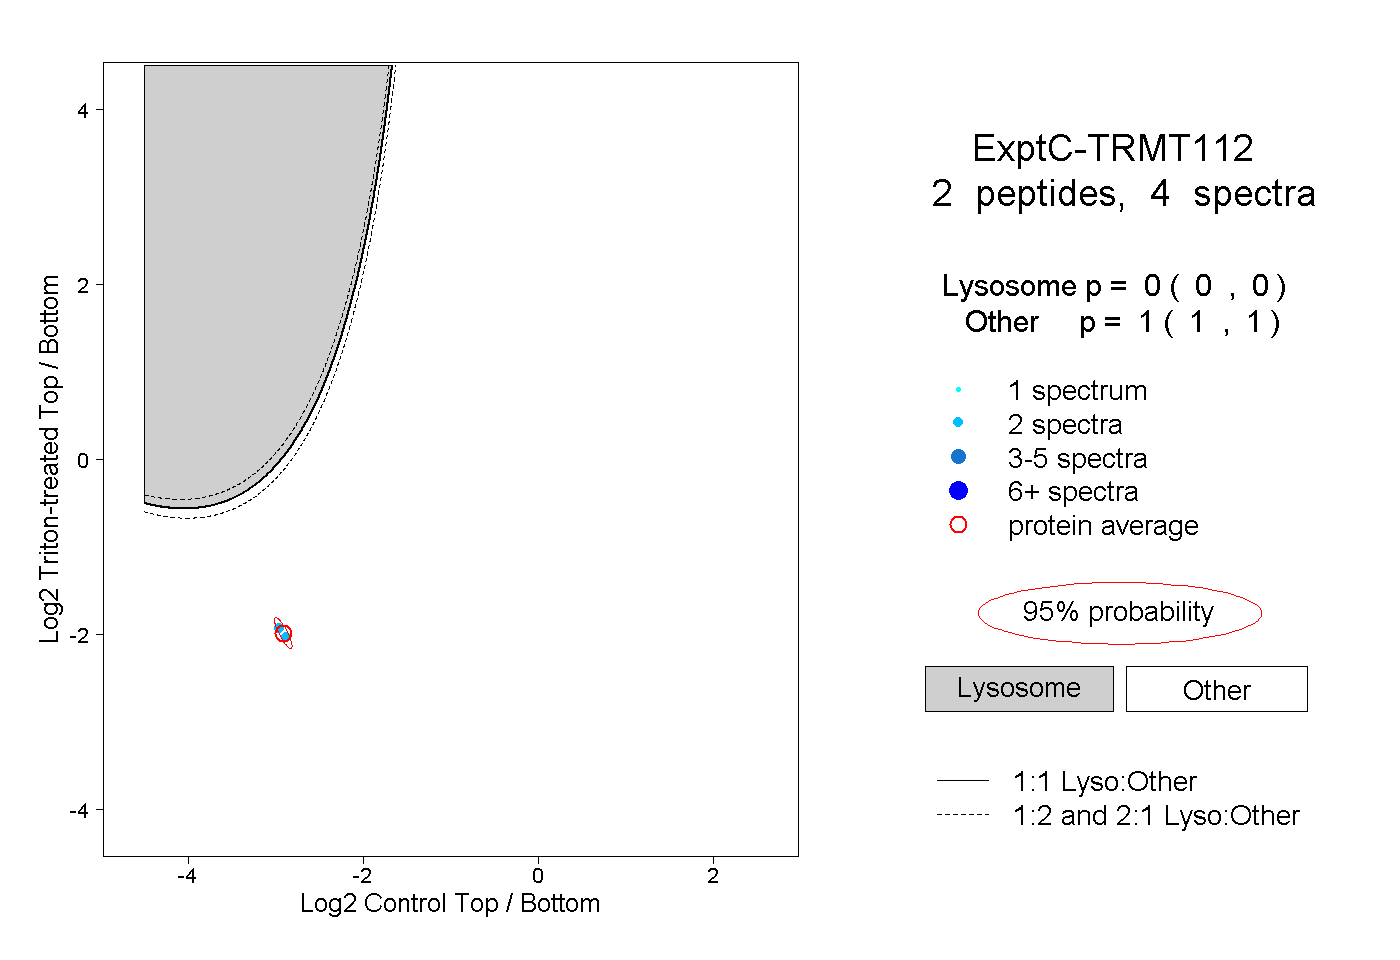
| Plot | Lyso | Other | |||||||||||
| Expt C |
2 peptides |
4 spectra |
|
0.000 0.000 | 0.000 |
1.000 1.000 | 1.000 |