 6
6peptides
spectra
0.000 | 0.000
0.000 | 0.042
0.000 | 0.023
0.000 | 0.105
0.000 | 0.127
0.000 | 0.131
0.811 | 0.876
0.000 | 0.000
2peptides
spectra
NA | NA
NA | NA
NA | NA
NA | NA
NA | NA
NA | NA
NA | NA
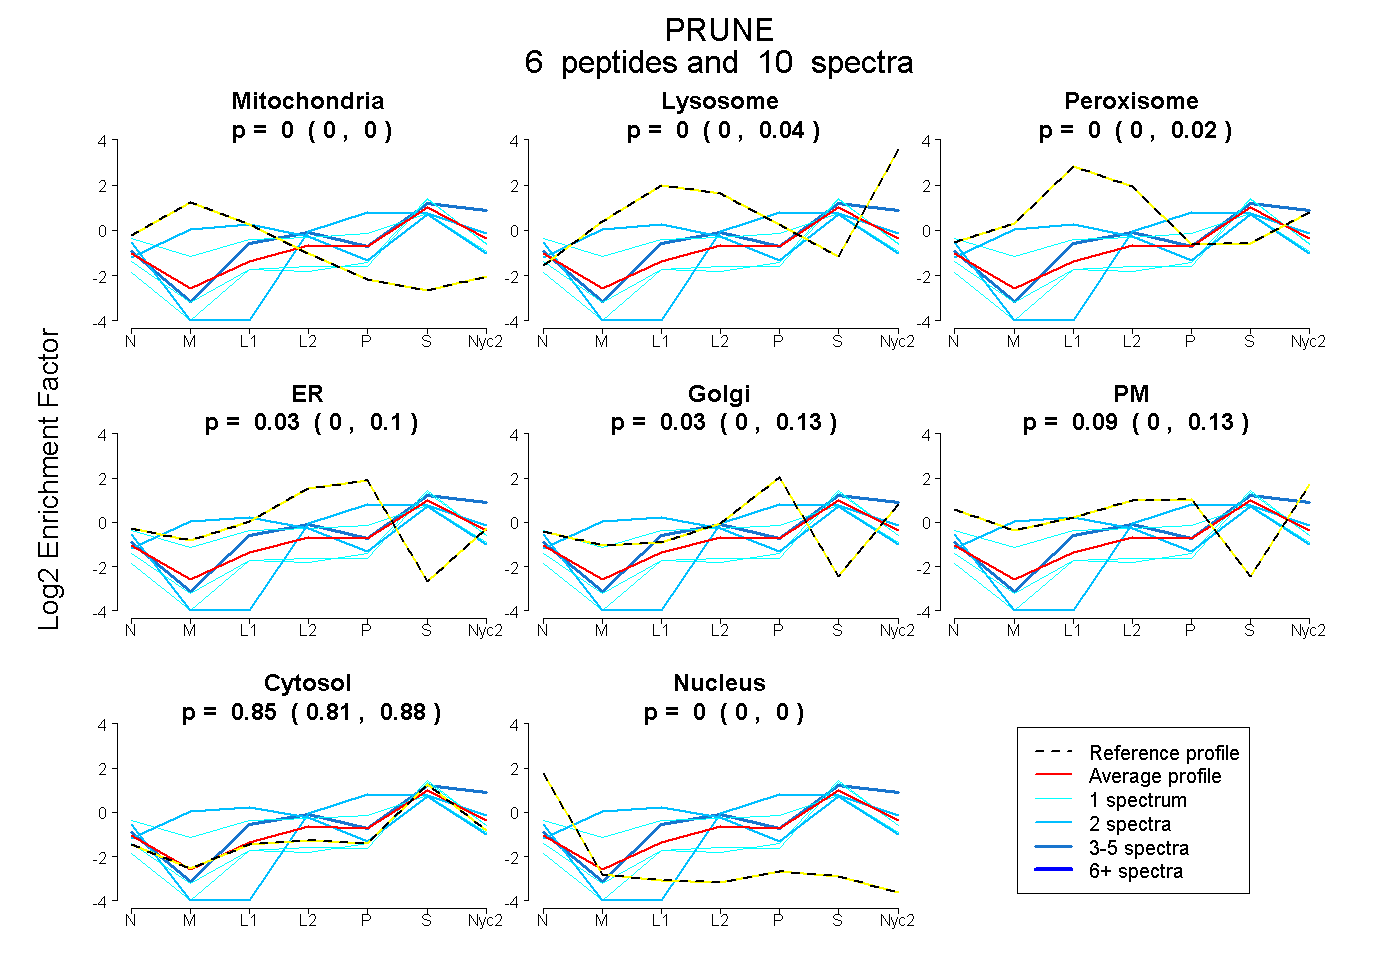
| Plot | Mito | Lyso | Perox | ER | Golgi | PM | Cytosol | Nucleus | |||||
| Expt A |
6 peptides |
10 spectra |
|
0.000 0.000 | 0.000 |
0.000 0.000 | 0.042 |
0.000 0.000 | 0.023 |
0.034 0.000 | 0.105 |
0.025 0.000 | 0.127 |
0.089 0.000 | 0.131 |
0.852 0.811 | 0.876 |
0.000 0.000 | 0.000 |
||
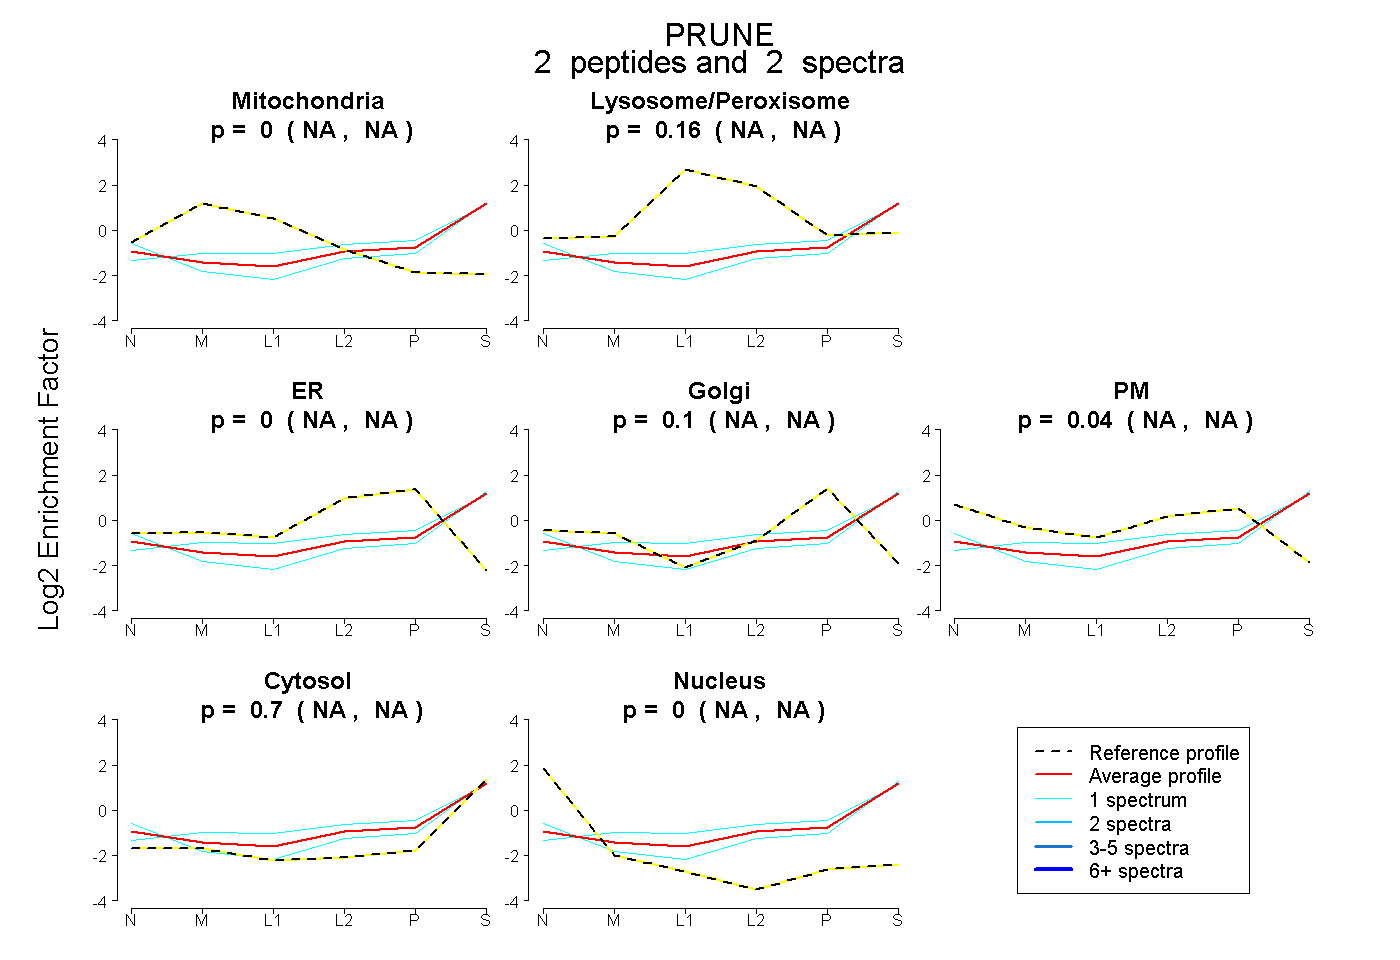
| Plot | Mito | Lyso or Perox | ER | Golgi | PM | Cytosol | Nucleus | ||||||
| Expt B |
2 peptides |
2 spectra |
|
0.000 NA | NA |
0.161 NA | NA |
0.000 NA | NA |
0.097 NA | NA |
0.042 NA | NA |
0.700 NA | NA |
0.000 NA | NA |
| 1 spectrum, ILQGAPETLDR | 0.000 | 0.000 | 0.000 | 0.000 | 0.213 | 0.787 | 0.000 | |||
| 1 spectrum, GDNVFFLQEVK | 0.000 | 0.273 | 0.007 | 0.110 | 0.000 | 0.610 | 0.000 |