 2
2peptides
spectra
0.000 | 0.000
0.000 | 0.000
0.000 | 0.018
0.000 | 0.032
0.000 | 0.019
0.000 | 0.000
0.904 | 0.971
0.001 | 0.083
1peptide
spectra
NA | NA
NA | NA
NA | NA
NA | NA
NA | NA
NA | NA
NA | NA
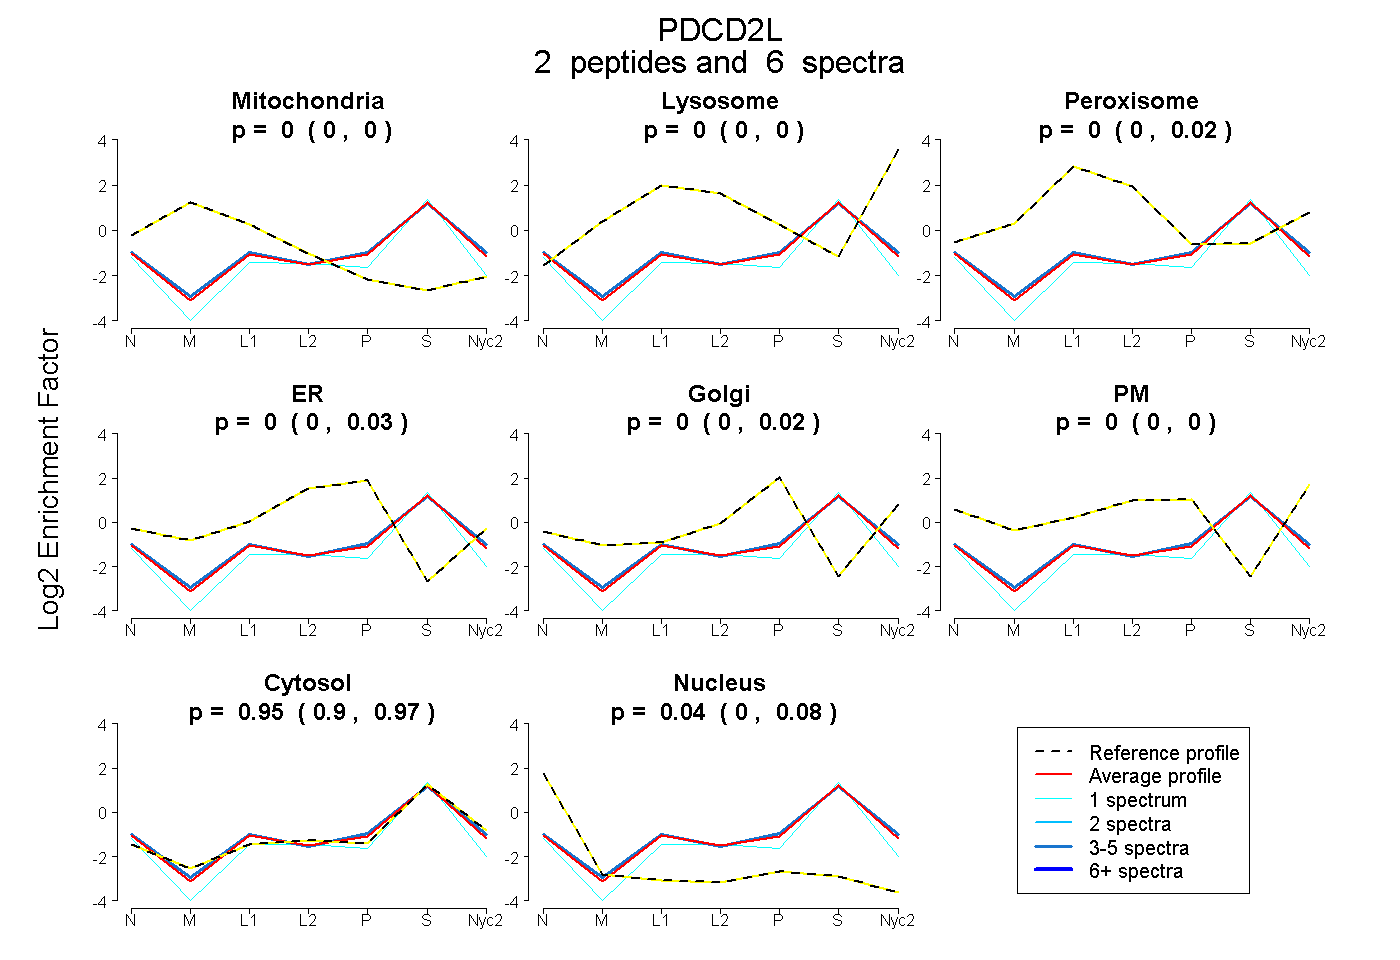
| Plot | Mito | Lyso | Perox | ER | Golgi | PM | Cytosol | Nucleus | |||||
| Expt A |
2 peptides |
6 spectra |
|
0.000 0.000 | 0.000 |
0.000 0.000 | 0.000 |
0.000 0.000 | 0.018 |
0.003 0.000 | 0.032 |
0.000 0.000 | 0.019 |
0.000 0.000 | 0.000 |
0.953 0.904 | 0.971 |
0.044 0.001 | 0.083 |
||
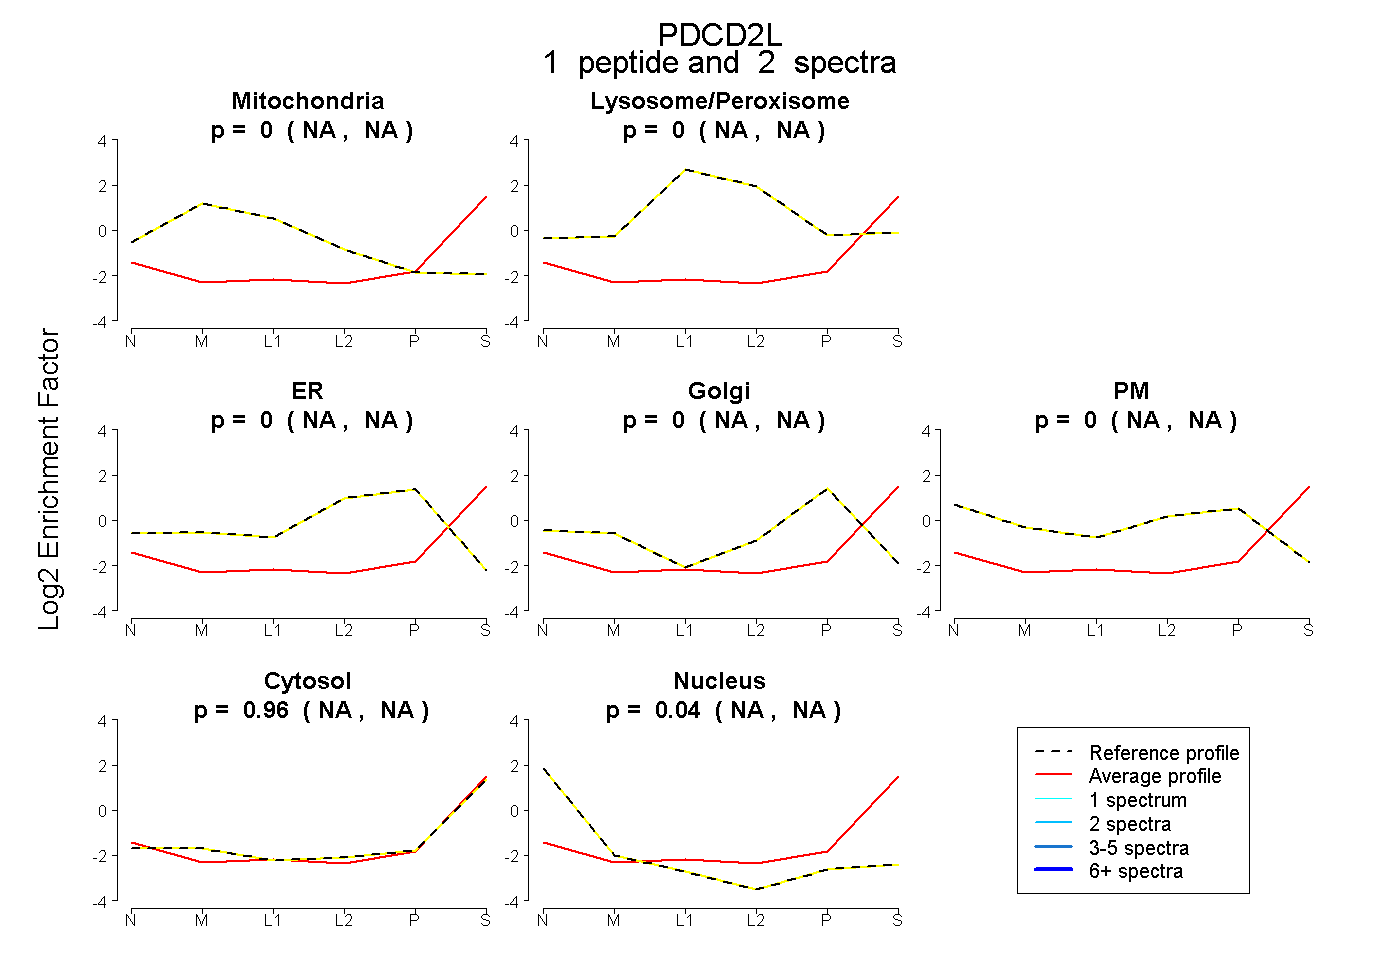
| Plot | Mito | Lyso or Perox | ER | Golgi | PM | Cytosol | Nucleus | ||||||
| Expt B |
1 peptide |
2 spectra |
|
0.000 NA | NA |
0.000 NA | NA |
0.000 NA | NA |
0.000 NA | NA |
0.000 NA | NA |
0.963 NA | NA |
0.037 NA | NA |