 5
5peptides
spectra
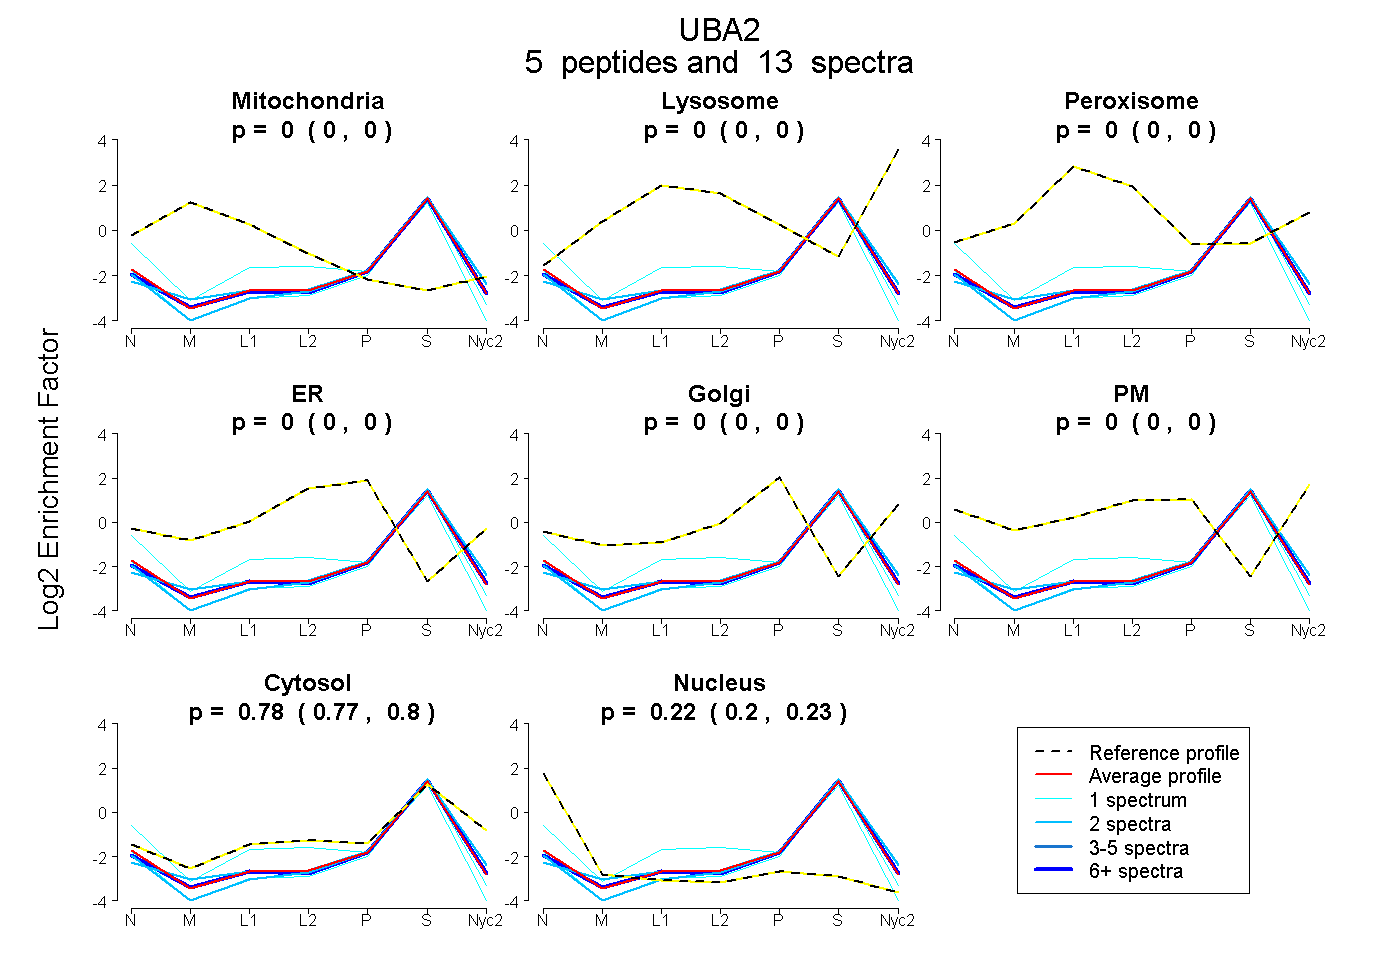
0.000 | 0.000
0.000 | 0.000
0.000 | 0.000
0.000 | 0.000
0.000 | 0.000
0.000 | 0.000
0.770 | 0.796
0.202 | 0.227
| Plot | Mito | Lyso | Perox | ER | Golgi | PM | Cytosol | Nucleus | |||||
| Expt A |
5 peptides |
13 spectra |
|
0.000 0.000 | 0.000 |
0.000 0.000 | 0.000 |
0.000 0.000 | 0.000 |
0.000 0.000 | 0.000 |
0.000 0.000 | 0.000 |
0.000 0.000 | 0.000 |
0.784 0.770 | 0.796 |
0.216 0.202 | 0.227 |
| 7 spectra, STGYDPVK | 0.000 | 0.000 | 0.000 | 0.000 | 0.000 | 0.000 | 0.798 | 0.202 | ||
| 2 spectra, YLLTMDK | 0.000 | 0.000 | 0.000 | 0.000 | 0.000 | 0.000 | 0.861 | 0.139 | ||
| 1 spectrum, QAEDAAK | 0.000 | 0.000 | 0.000 | 0.000 | 0.000 | 0.000 | 0.729 | 0.271 | ||
| 1 spectrum, QFILVMNALDNR | 0.000 | 0.000 | 0.000 | 0.000 | 0.000 | 0.000 | 0.692 | 0.308 | ||
| 2 spectra, TIFLNK | 0.000 | 0.000 | 0.000 | 0.000 | 0.000 | 0.000 | 0.815 | 0.185 |
| Plot | Mito | Lyso or Perox | ER | Golgi | PM | Cytosol | Nucleus | ||||||
| Expt B |
1 peptide |
2 spectra |
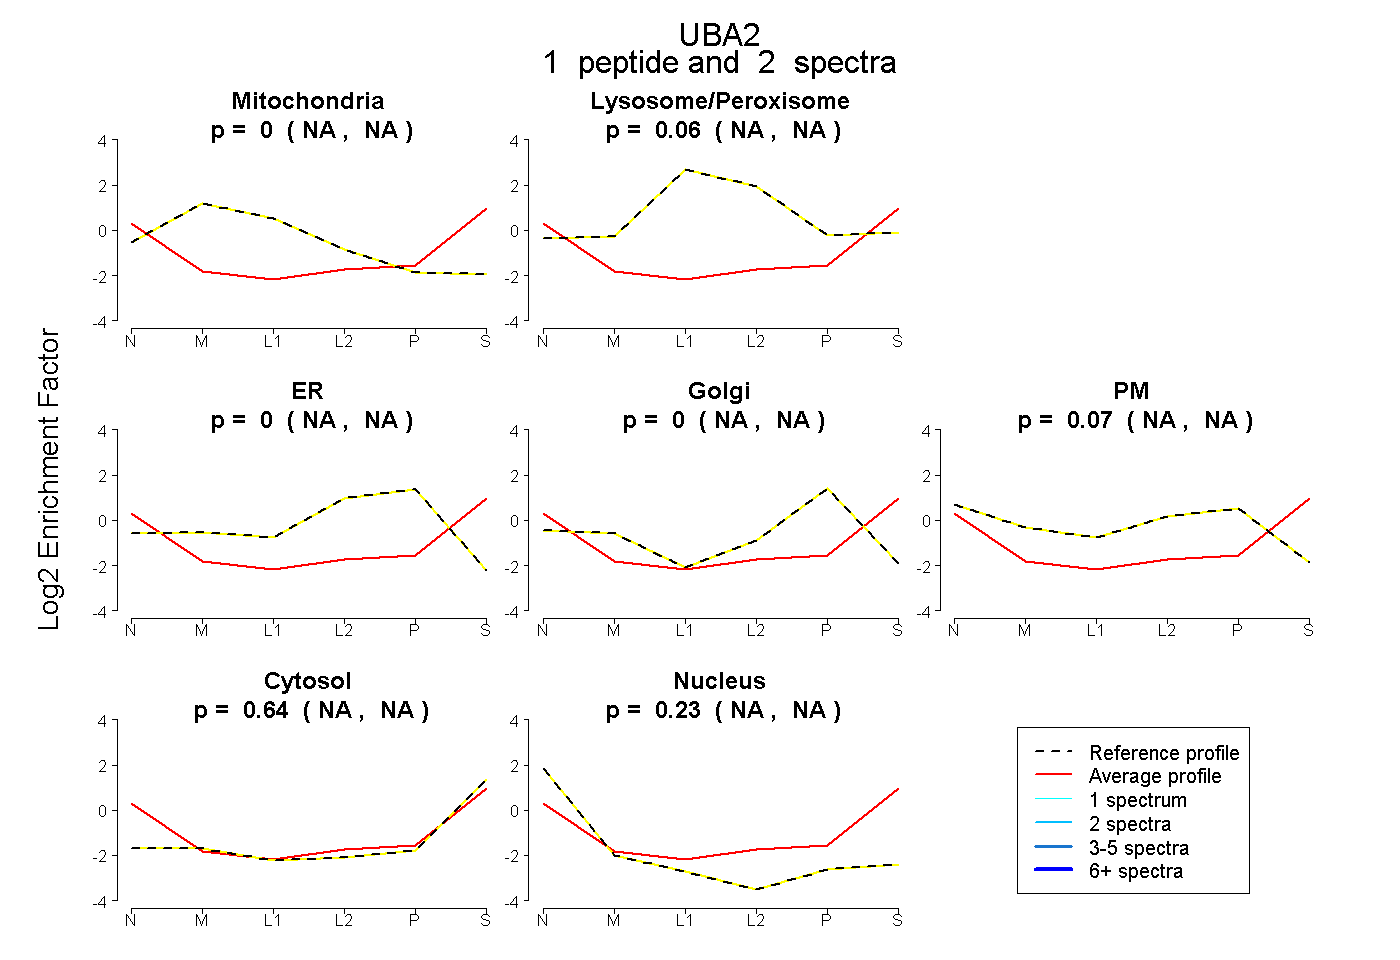 |
0.000 NA | NA |
0.063 NA | NA |
0.000 NA | NA |
0.000 NA | NA |
0.065 NA | NA |
0.639 NA | NA |
0.233 NA | NA |
|||
| Plot | Lyso | Other | |||||||||||
| Expt C |
2 peptides |
4 spectra |
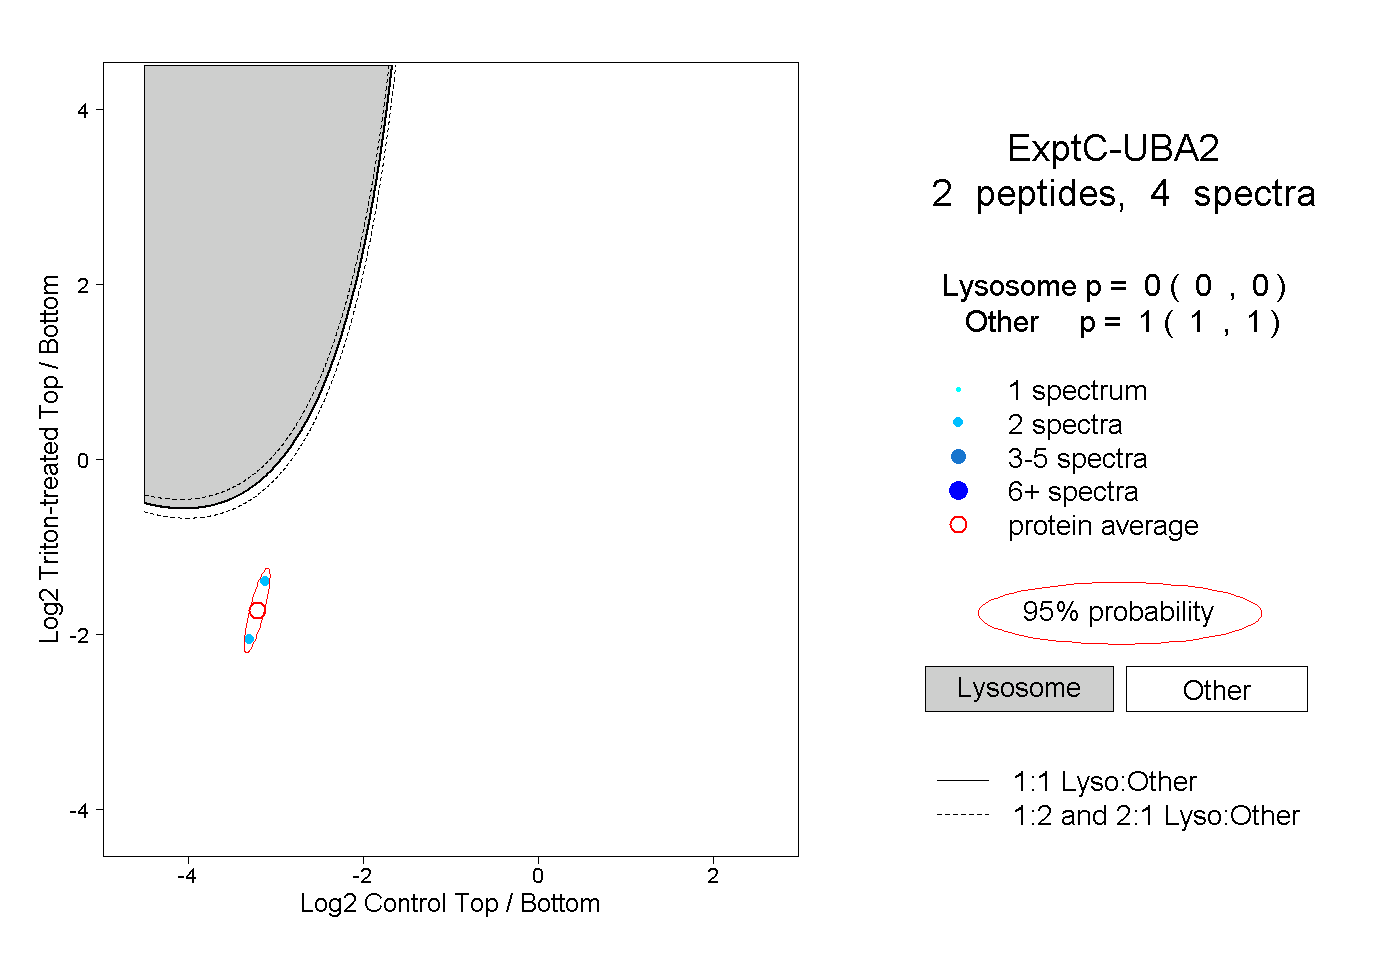 |
0.000 0.000 | 0.000 |
1.000 1.000 | 1.000 |