 5
5peptides
spectra
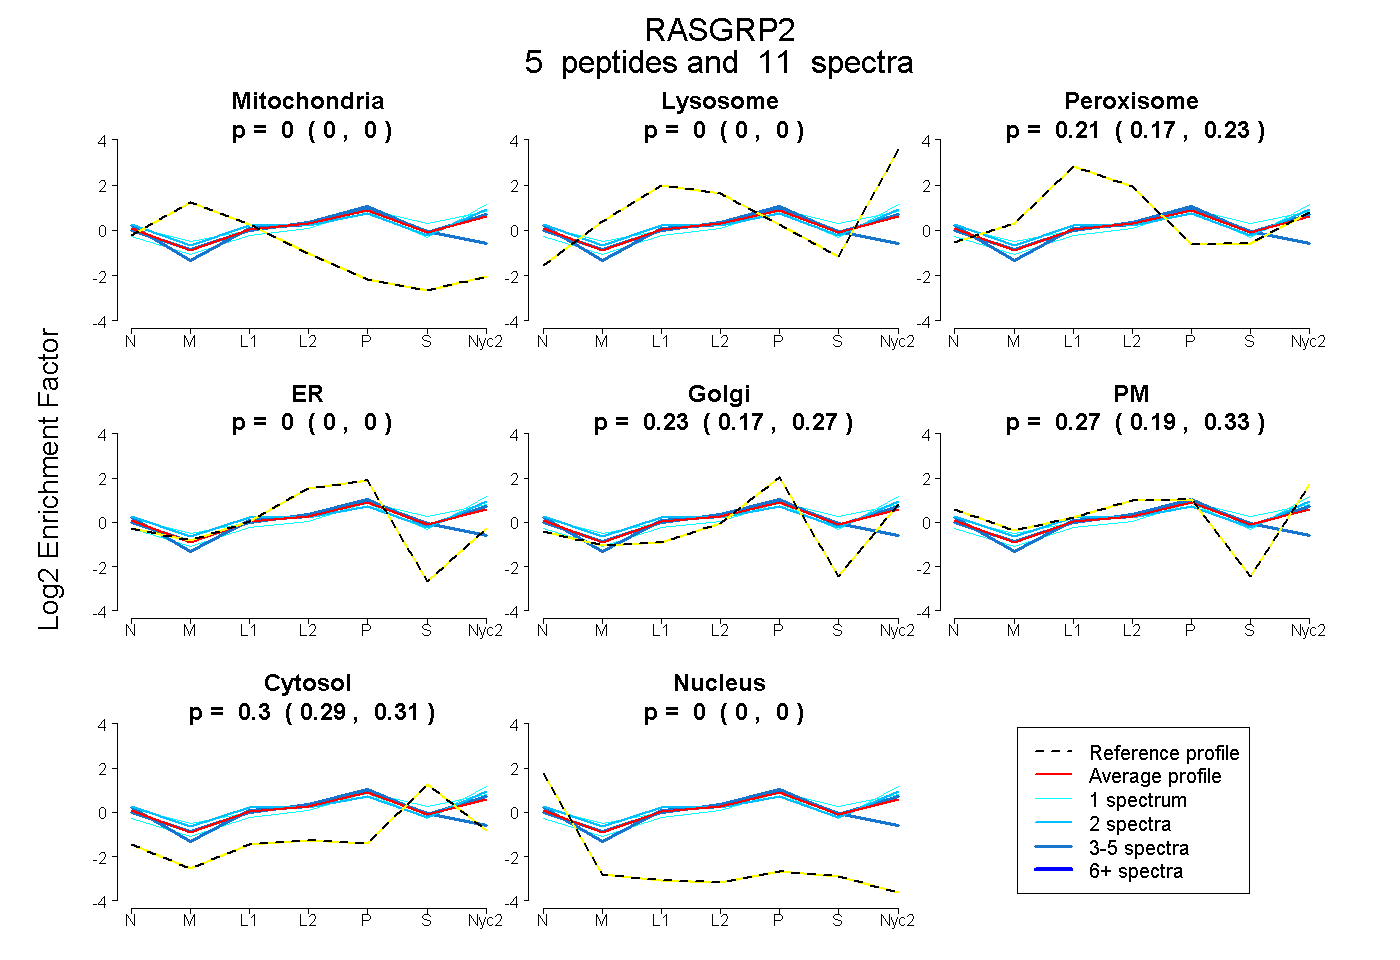
0.000 | 0.000
0.000 | 0.000
0.174 | 0.231
0.000 | 0.000
0.167 | 0.271
0.190 | 0.335
0.286 | 0.306
0.000 | 0.000
1peptide
spectrum
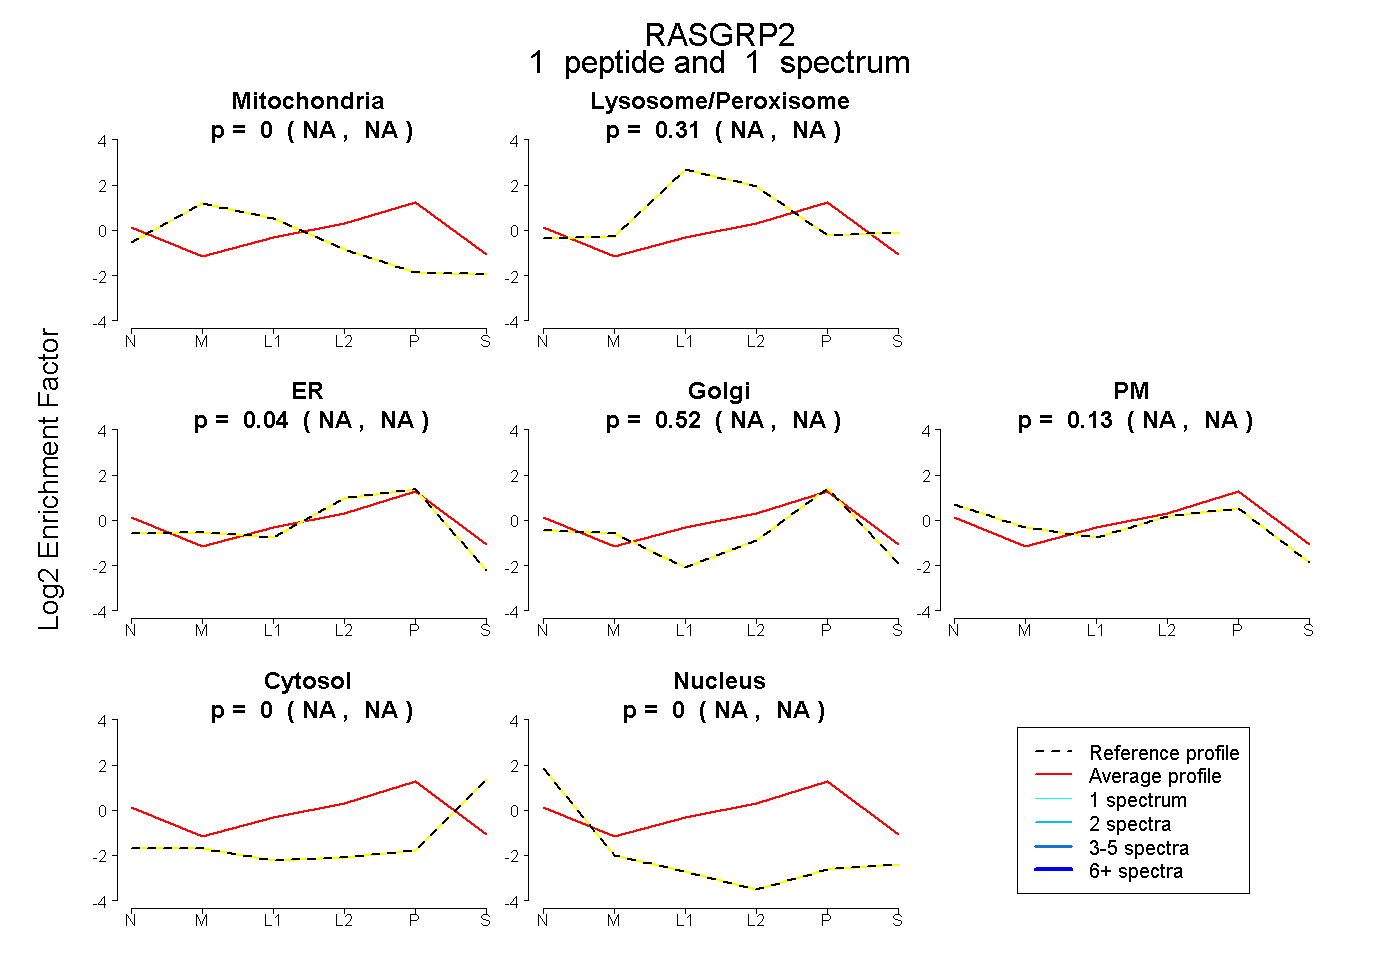
NA | NA
NA | NA
NA | NA
NA | NA
NA | NA
NA | NA
NA | NA
3peptides
spectra
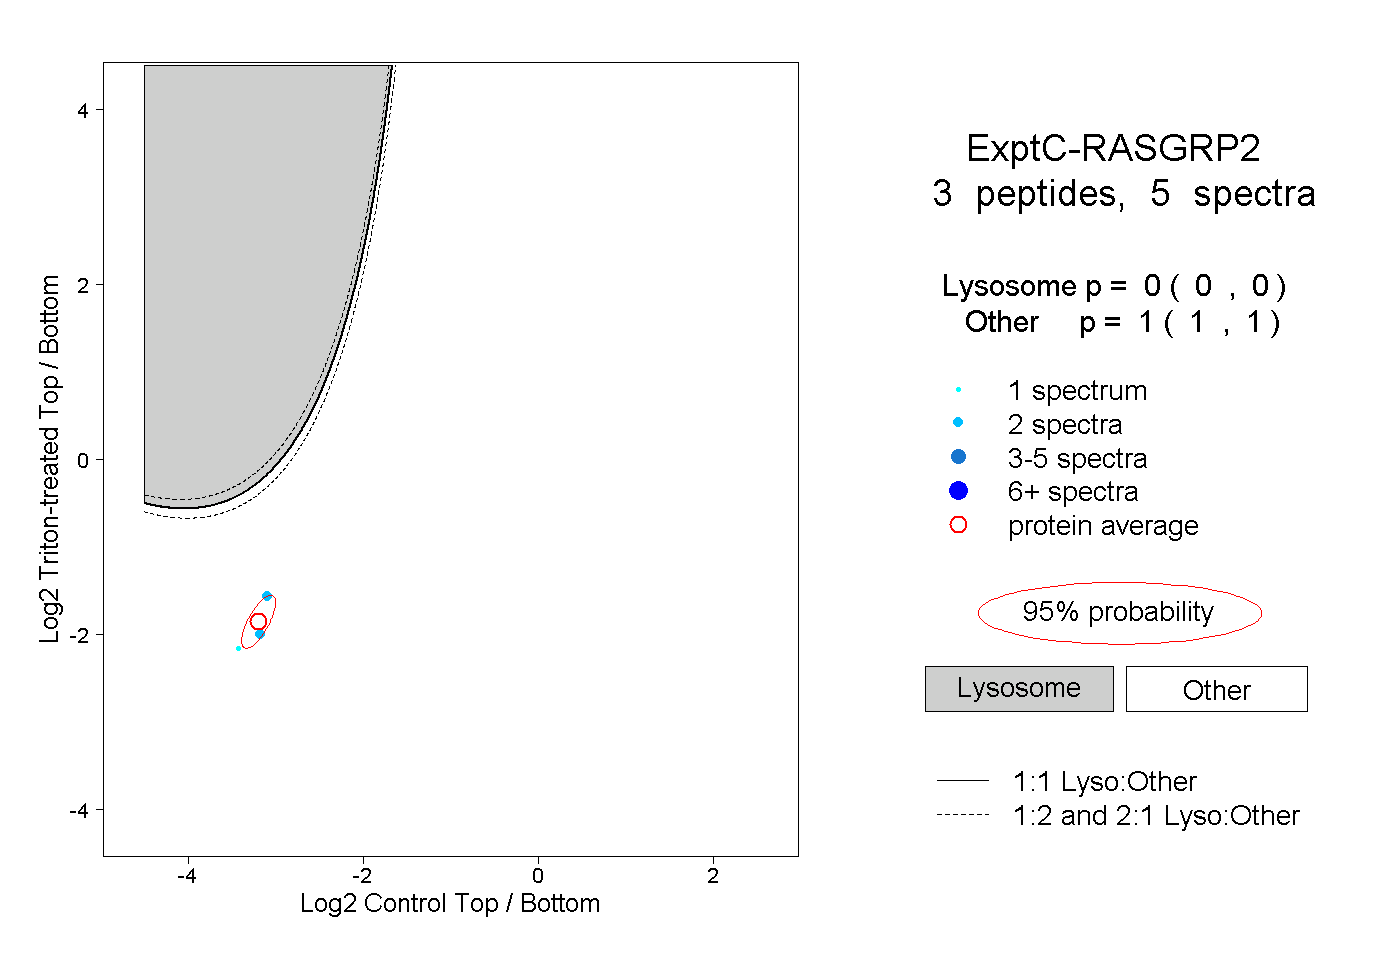
0.000 | 0.000
1.000 | 1.000