HPN
[ENSRNOP00000028644]
Main page
| | | Plot |
Mito |
Lyso |
|
Perox |
ER |
Golgi |
PM |
Cytosol |
Nucleus |
|
| Expt A |
 12
12
peptides |
34
spectra |
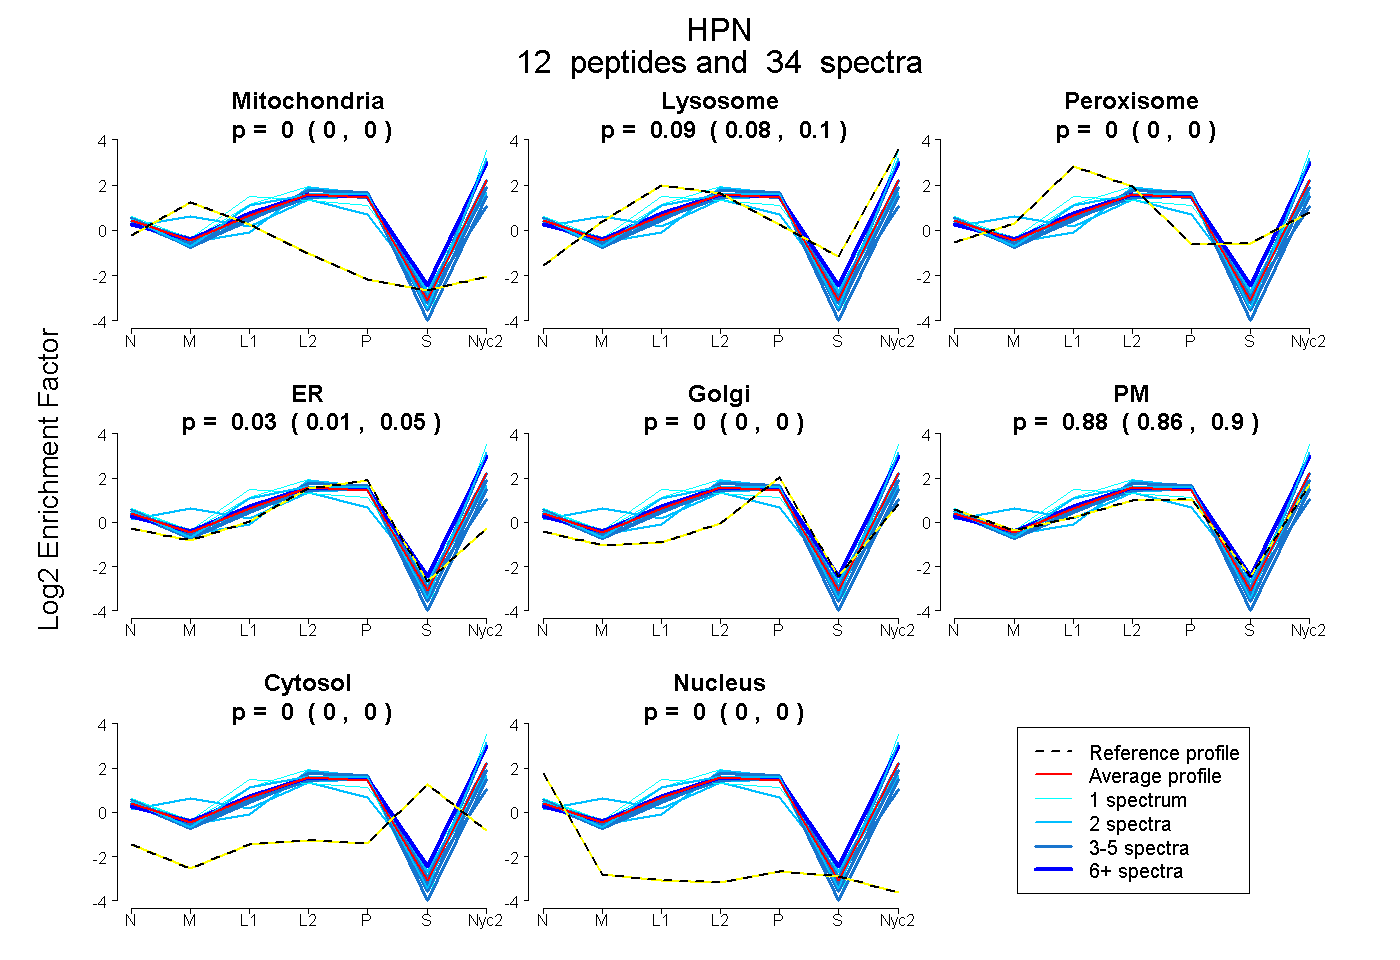 |
0.000
0.000 | 0.000 |
0.091
0.081 | 0.099 |
|
0.000
0.000 | 0.000 |
0.031
0.008 | 0.051 |
0.000
0.000 | 0.000 |
0.878
0.857 | 0.896 |
0.000
0.000 | 0.000 |
0.000
0.000 | 0.000 |
|
| | | Plot |
Mito |
|
Lyso or Perox |
|
ER |
Golgi |
PM |
Cytosol |
Nucleus |
|
| Expt B |
5
peptides |
12
spectra |
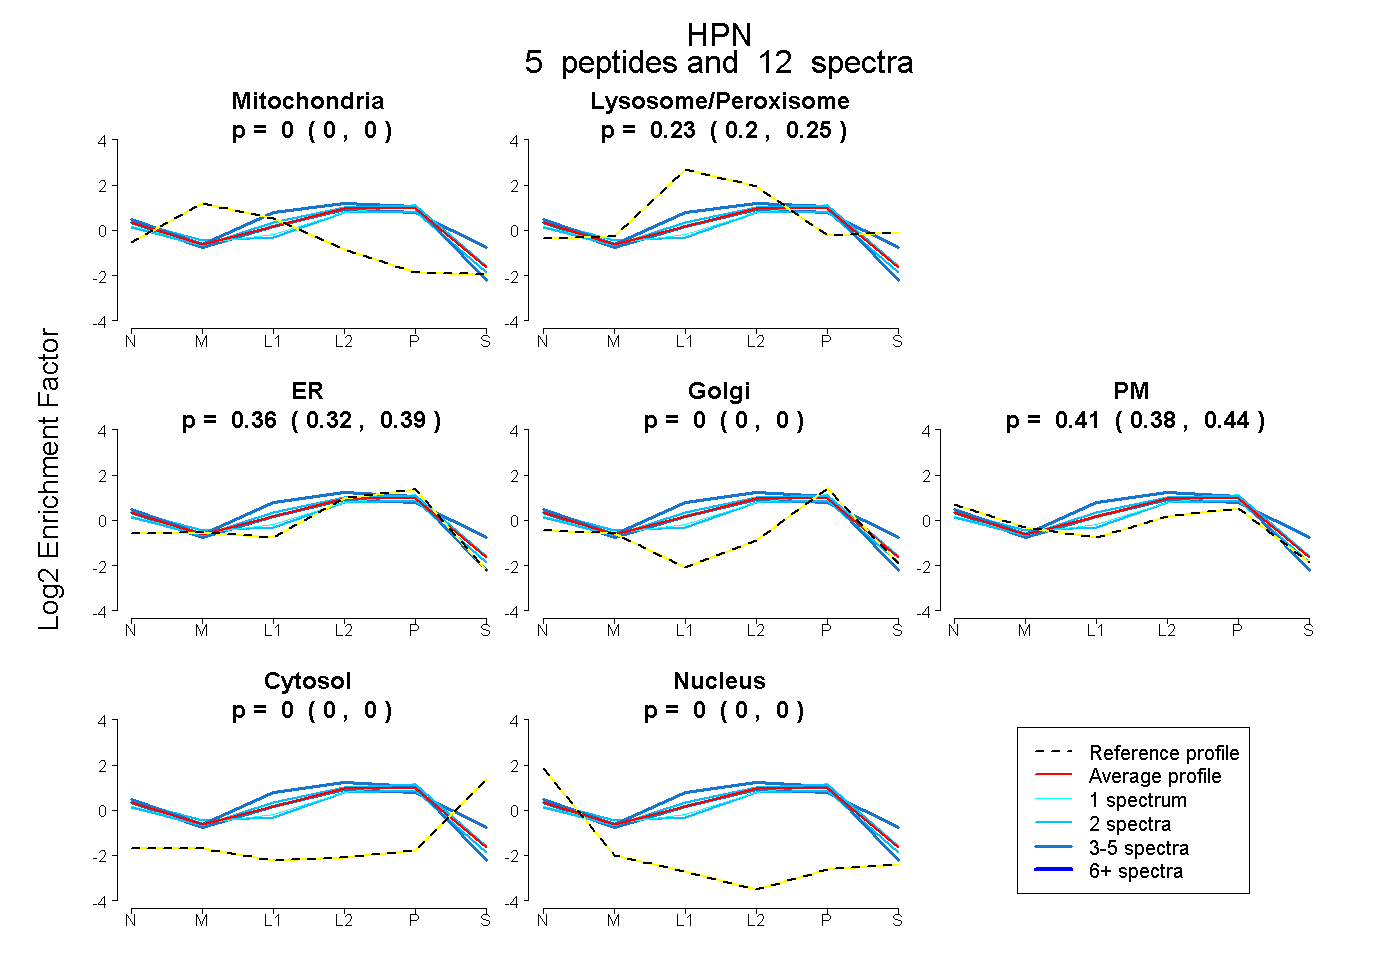 |
0.000
0.000 | 0.000 |
|
0.229
0.200 | 0.251 |
|
0.358
0.320 | 0.389 |
0.000
0.000 | 0.000 |
0.414
0.382 | 0.438 |
0.000
0.000 | 0.000 |
0.000
0.000 | 0.000 |
|
| 4 spectra, VFAGAVAR |
0.000 |
|
0.293 |
|
0.418 |
0.000 |
0.289 |
0.000 |
0.000 |
|
| 1 spectrum, LLDVISVCDCPR |
0.000 |
|
0.148 |
|
0.466 |
0.000 |
0.385 |
0.000 |
0.000 |
|
| 3 spectra, IVGGQDSSLGR |
0.000 |
|
0.366 |
|
0.085 |
0.127 |
0.403 |
0.019 |
0.000 |
|
| 2 spectra, WPWQVSLR |
0.000 |
|
0.261 |
|
0.461 |
0.000 |
0.278 |
0.000 |
0.000 |
|
| 2 spectra, LLCSSR |
0.000 |
|
0.109 |
|
0.320 |
0.000 |
0.570 |
0.000 |
0.000 |
|
| | | Plot |
|
Lyso |
|
|
|
|
|
|
|
Other |
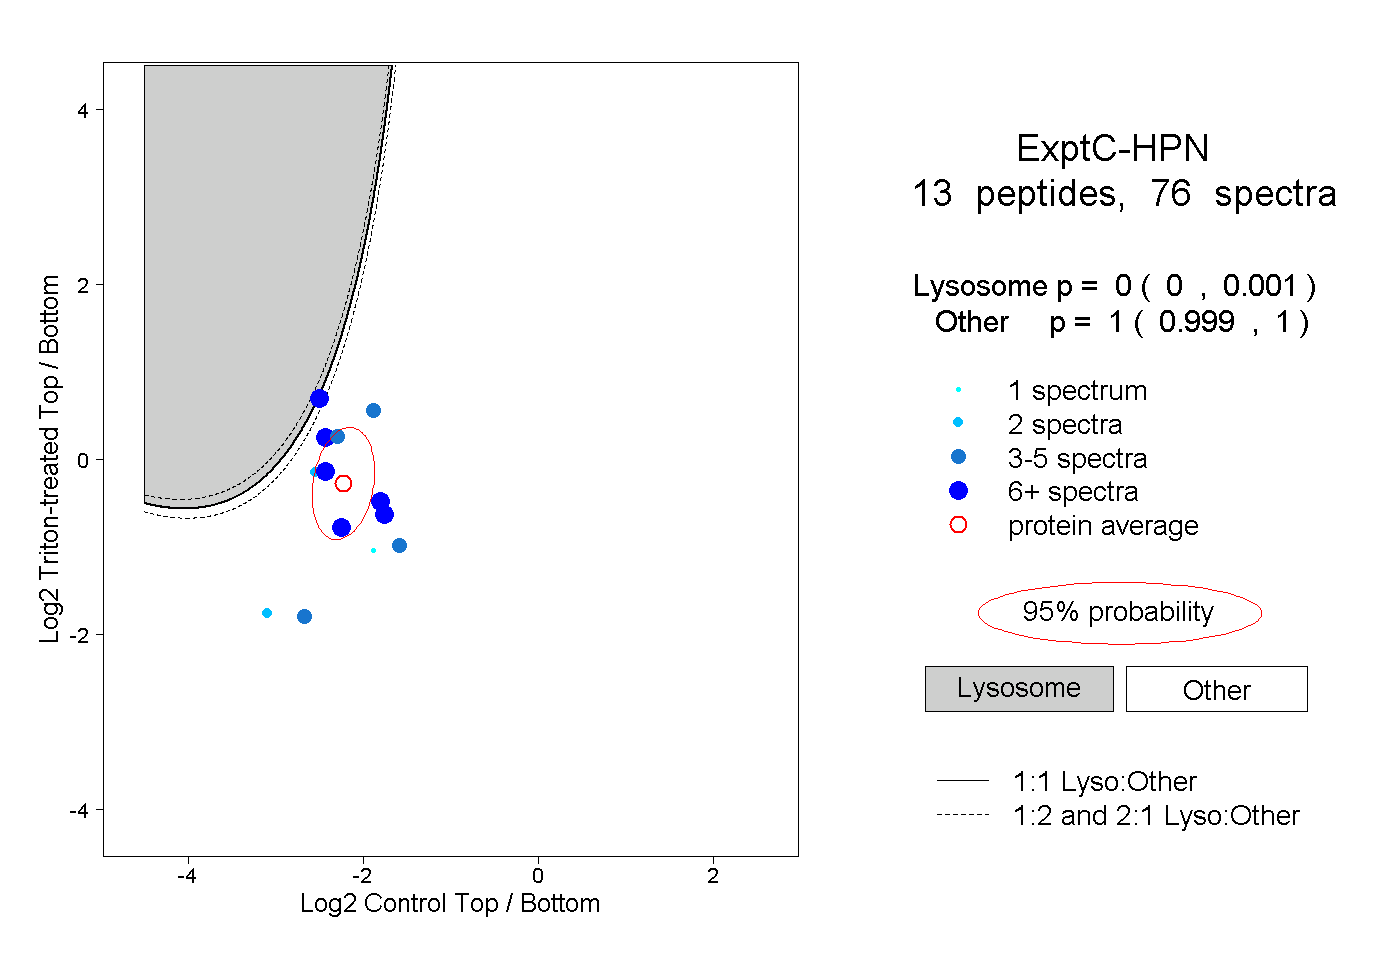
| Expt C |
13
peptides |
76
spectra |
 |
|
0.000
0.000 | 0.001 |
|
|
|
|
|
|
|
1.000
0.999 | 1.000 |
| | | Plot |
|
Lyso |
|
|
|
|
|
|
|
Other |
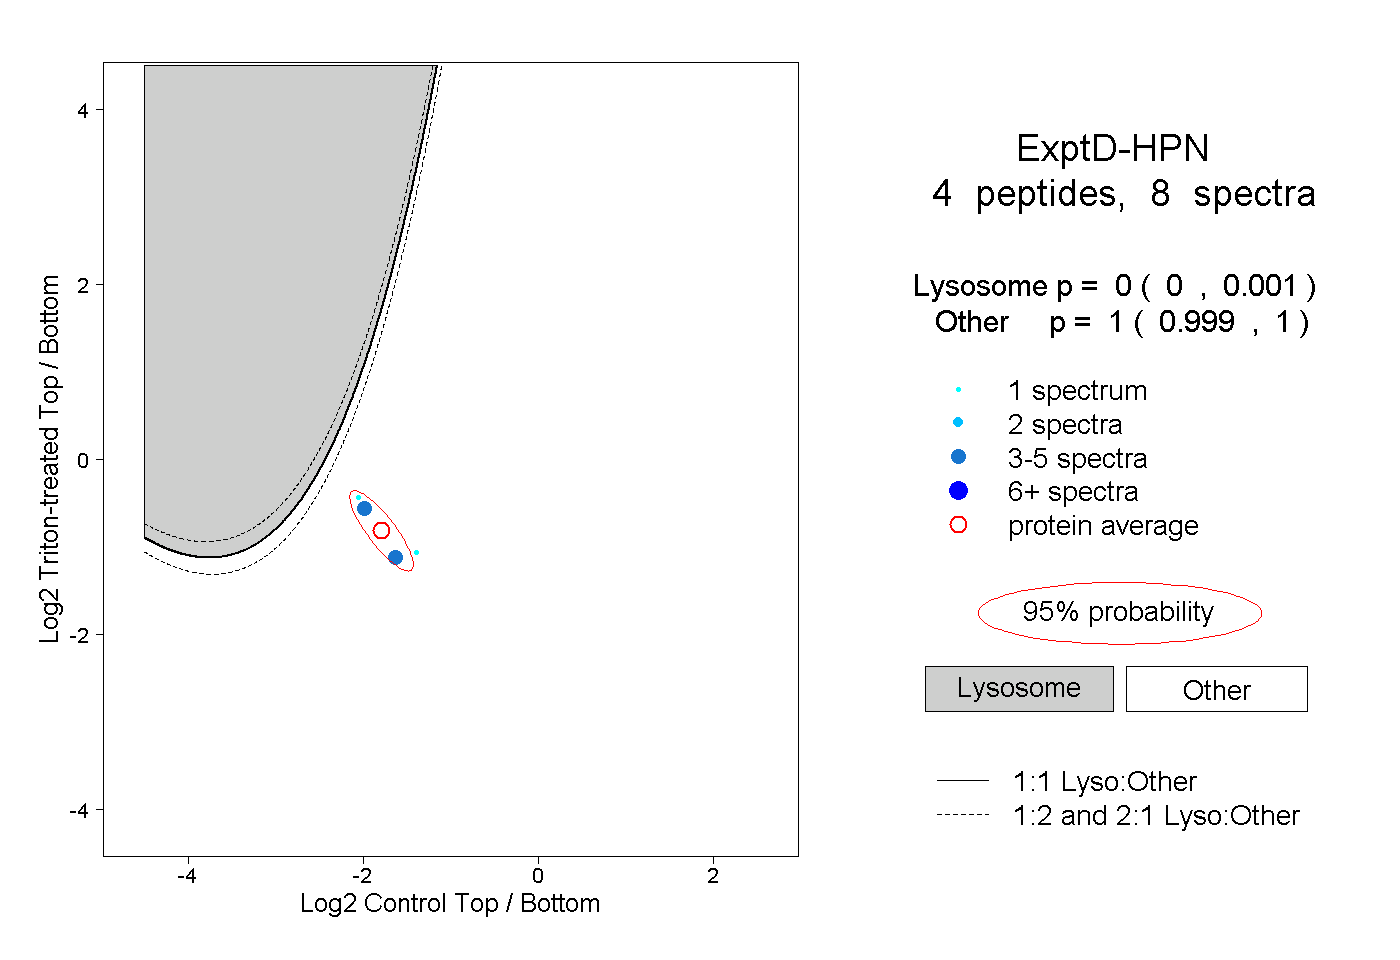
| Expt D |
4
peptides |
8
spectra |
 |
|
0.000
0.000 | 0.001 |
|
|
|
|
|
|
|
1.000
0.999 | 1.000 |