 12
12peptides
spectra
0.000 | 0.000
0.081 | 0.099
0.000 | 0.000
0.008 | 0.051
0.000 | 0.000
0.857 | 0.896
0.000 | 0.000
0.000 | 0.000
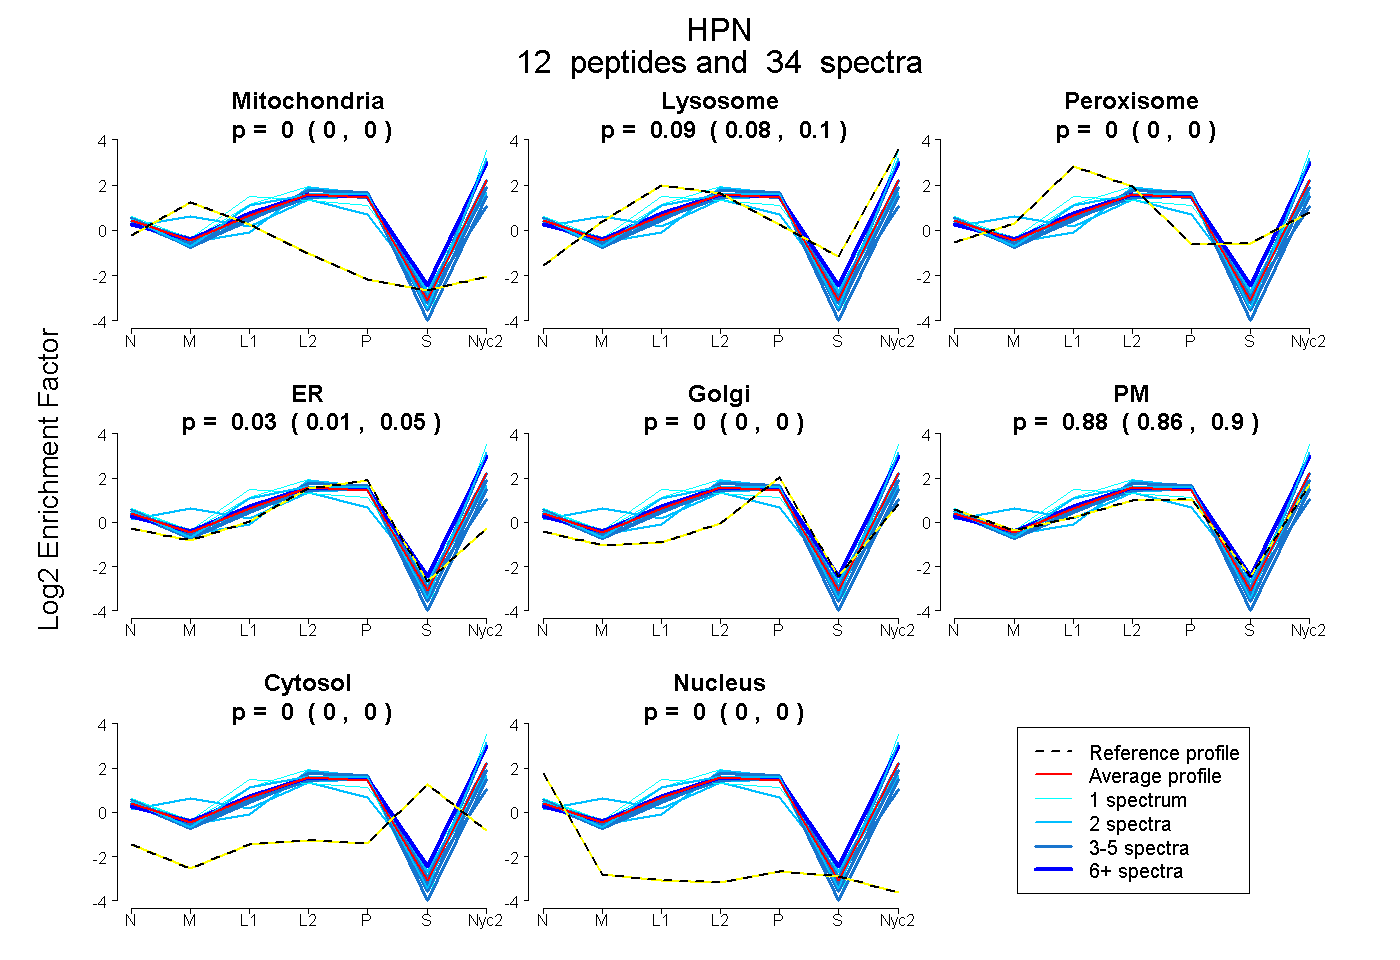
| Plot | Mito | Lyso | Perox | ER | Golgi | PM | Cytosol | Nucleus | |||||
| Expt A |
12 peptides |
34 spectra |
|
0.000 0.000 | 0.000 |
0.091 0.081 | 0.099 |
0.000 0.000 | 0.000 |
0.031 0.008 | 0.051 |
0.000 0.000 | 0.000 |
0.878 0.857 | 0.896 |
0.000 0.000 | 0.000 |
0.000 0.000 | 0.000 |
| 6 spectra, VFAGAVAR | 0.000 | 0.274 | 0.000 | 0.000 | 0.000 | 0.726 | 0.000 | 0.000 | ||
| 4 spectra, IVGGQDSSLGR | 0.000 | 0.163 | 0.000 | 0.000 | 0.000 | 0.837 | 0.000 | 0.000 | ||
| 2 spectra, ALAHSELDVR | 0.000 | 0.083 | 0.000 | 0.102 | 0.000 | 0.815 | 0.000 | 0.000 | ||
| 1 spectrum, THSEATGMVTQP | 0.000 | 0.096 | 0.158 | 0.000 | 0.000 | 0.746 | 0.000 | 0.000 | ||
| 4 spectra, LLCSSR | 0.000 | 0.018 | 0.014 | 0.378 | 0.000 | 0.589 | 0.000 | 0.000 | ||
| 3 spectra, LLVLDK | 0.000 | 0.062 | 0.000 | 0.040 | 0.000 | 0.898 | 0.000 | 0.000 | ||
| 2 spectra, FLTATCQDCGR | 0.000 | 0.016 | 0.000 | 0.273 | 0.000 | 0.710 | 0.000 | 0.000 | ||
| 1 spectrum, EWIFQAIK | 0.000 | 0.225 | 0.000 | 0.000 | 0.000 | 0.775 | 0.000 | 0.000 | ||
| 2 spectra, WPWQVSLR | 0.000 | 0.204 | 0.000 | 0.000 | 0.000 | 0.796 | 0.000 | 0.000 | ||
| 3 spectra, VAGLGCEEMGFLR | 0.000 | 0.000 | 0.000 | 0.182 | 0.000 | 0.818 | 0.000 | 0.000 | ||
| 2 spectra, KPGVYTK | 0.093 | 0.140 | 0.000 | 0.007 | 0.000 | 0.760 | 0.000 | 0.000 | ||
| 4 spectra, TAPCCSRPK | 0.000 | 0.000 | 0.000 | 0.278 | 0.000 | 0.722 | 0.000 | 0.000 |
| Plot | Mito | Lyso or Perox | ER | Golgi | PM | Cytosol | Nucleus | ||||||
| Expt B |
5 peptides |
12 spectra |
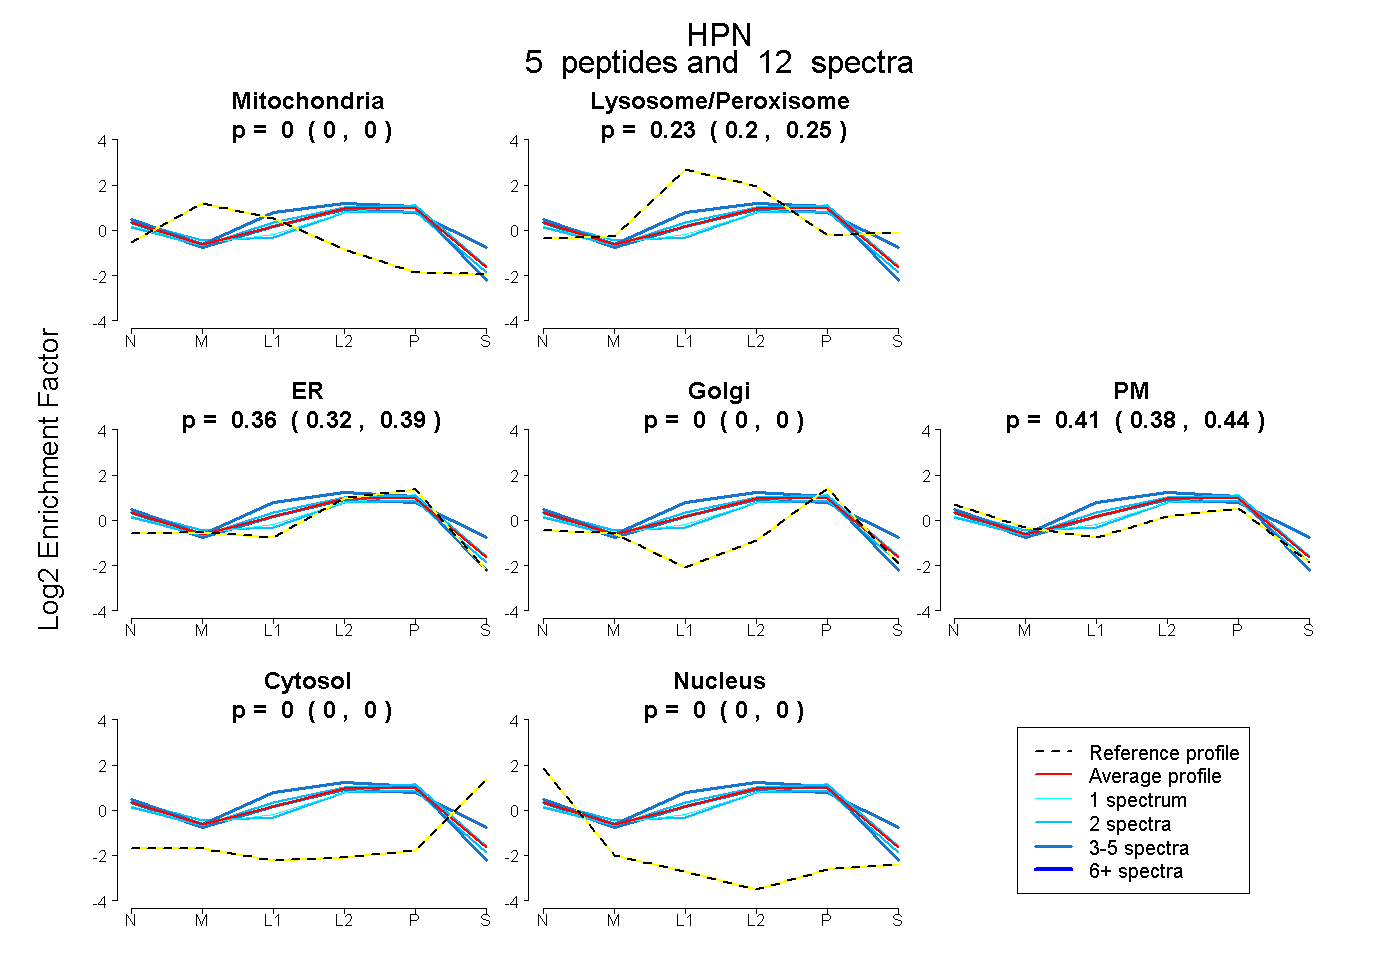 |
0.000 0.000 | 0.000 |
0.229 0.200 | 0.251 |
0.358 0.320 | 0.389 |
0.000 0.000 | 0.000 |
0.414 0.382 | 0.438 |
0.000 0.000 | 0.000 |
0.000 0.000 | 0.000 |
|||
| Plot | Lyso | Other | |||||||||||
| Expt C |
13 peptides |
76 spectra |
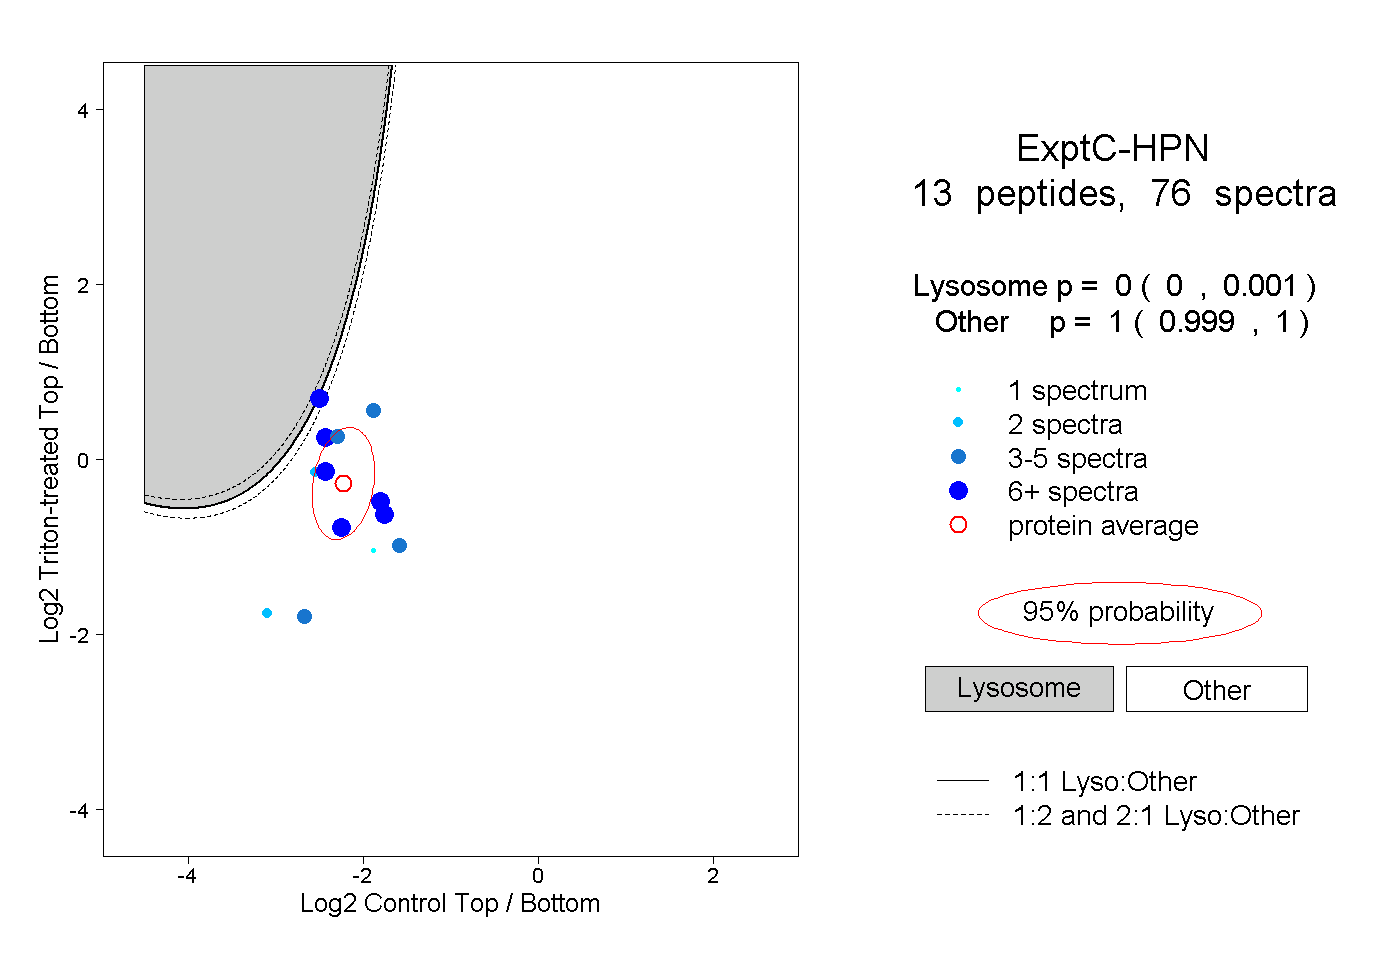 |
0.000 0.000 | 0.001 |
1.000 0.999 | 1.000 |
||||||||
| Plot | Lyso | Other | |||||||||||
| Expt D |
4 peptides |
8 spectra |
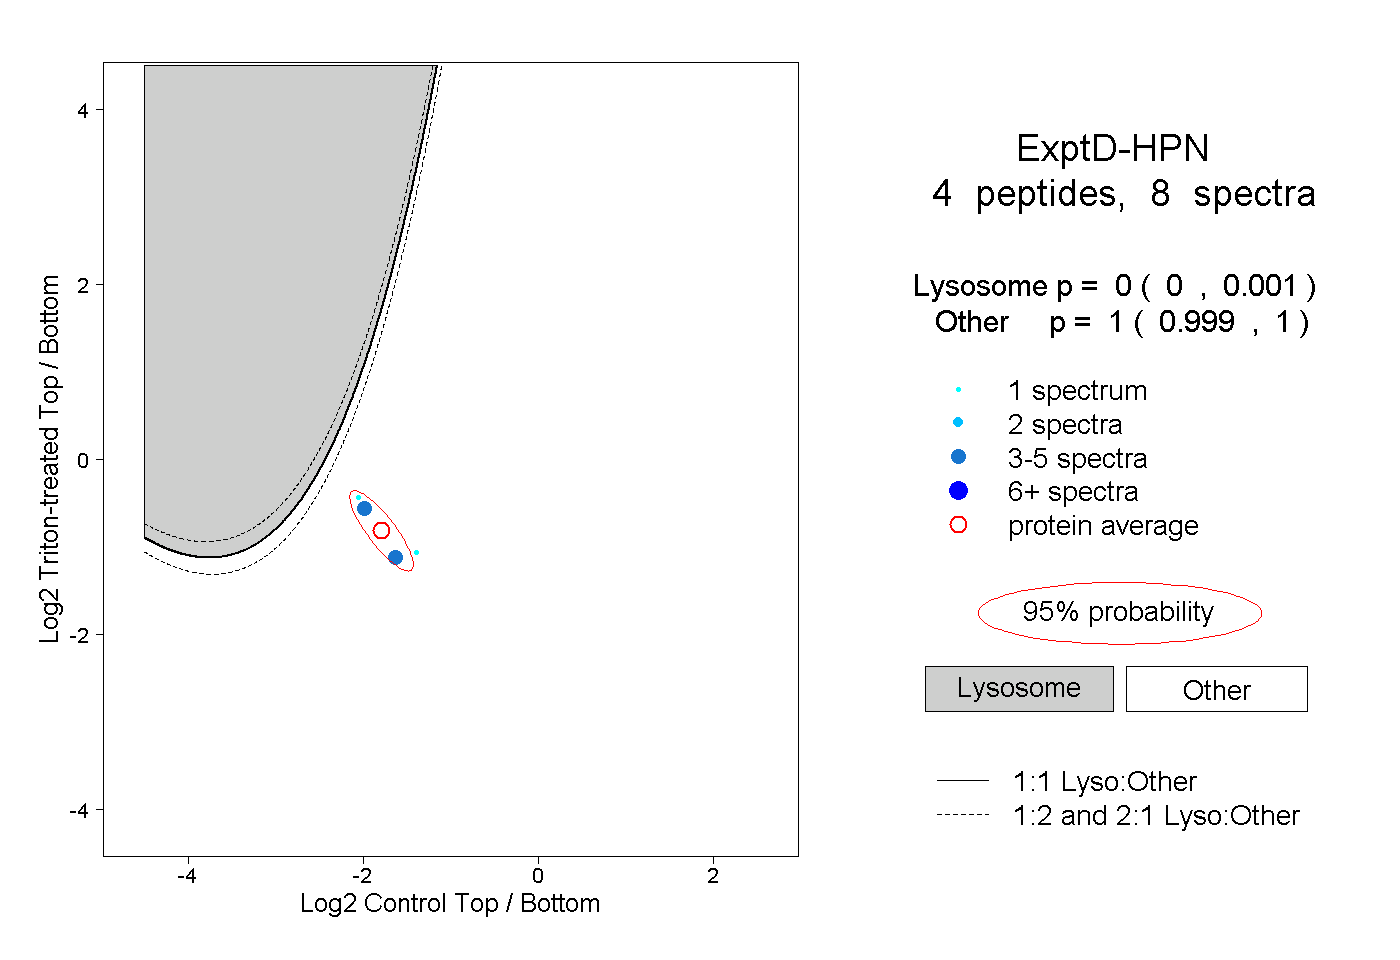 |
0.000 0.000 | 0.001 |
1.000 0.999 | 1.000 |