 2
2peptides
spectra
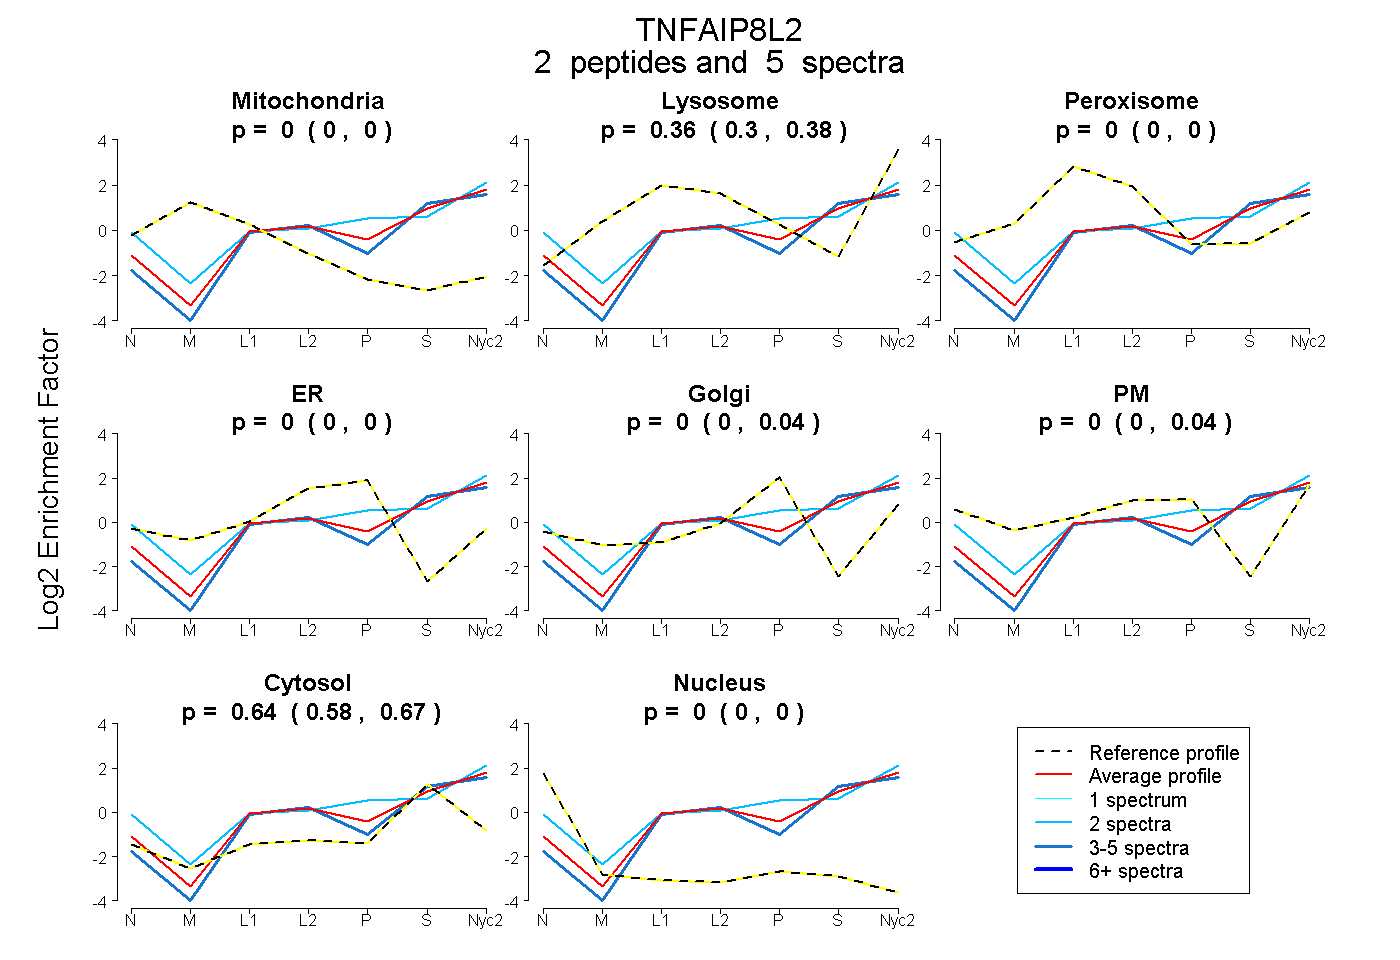
0.000 | 0.000
0.302 | 0.383
0.000 | 0.000
0.000 | 0.000
0.000 | 0.044
0.000 | 0.044
0.580 | 0.668
0.000 | 0.000
| Plot | Mito | Lyso | Perox | ER | Golgi | PM | Cytosol | Nucleus | |||||
| Expt A |
2 peptides |
5 spectra |
|
0.000 0.000 | 0.000 |
0.361 0.302 | 0.383 |
0.000 0.000 | 0.000 |
0.000 0.000 | 0.000 |
0.000 0.000 | 0.044 |
0.000 0.000 | 0.044 |
0.639 0.580 | 0.668 |
0.000 0.000 | 0.000 |
| 3 spectra, EILLELVEHHLTPK | 0.000 | 0.285 | 0.000 | 0.000 | 0.000 | 0.000 | 0.715 | 0.000 | ||
| 2 spectra, VAVLHR | 0.000 | 0.275 | 0.000 | 0.000 | 0.000 | 0.266 | 0.460 | 0.000 |
| Plot | Lyso | Other | |||||||||||
| Expt C |
1 peptide |
1 spectrum |
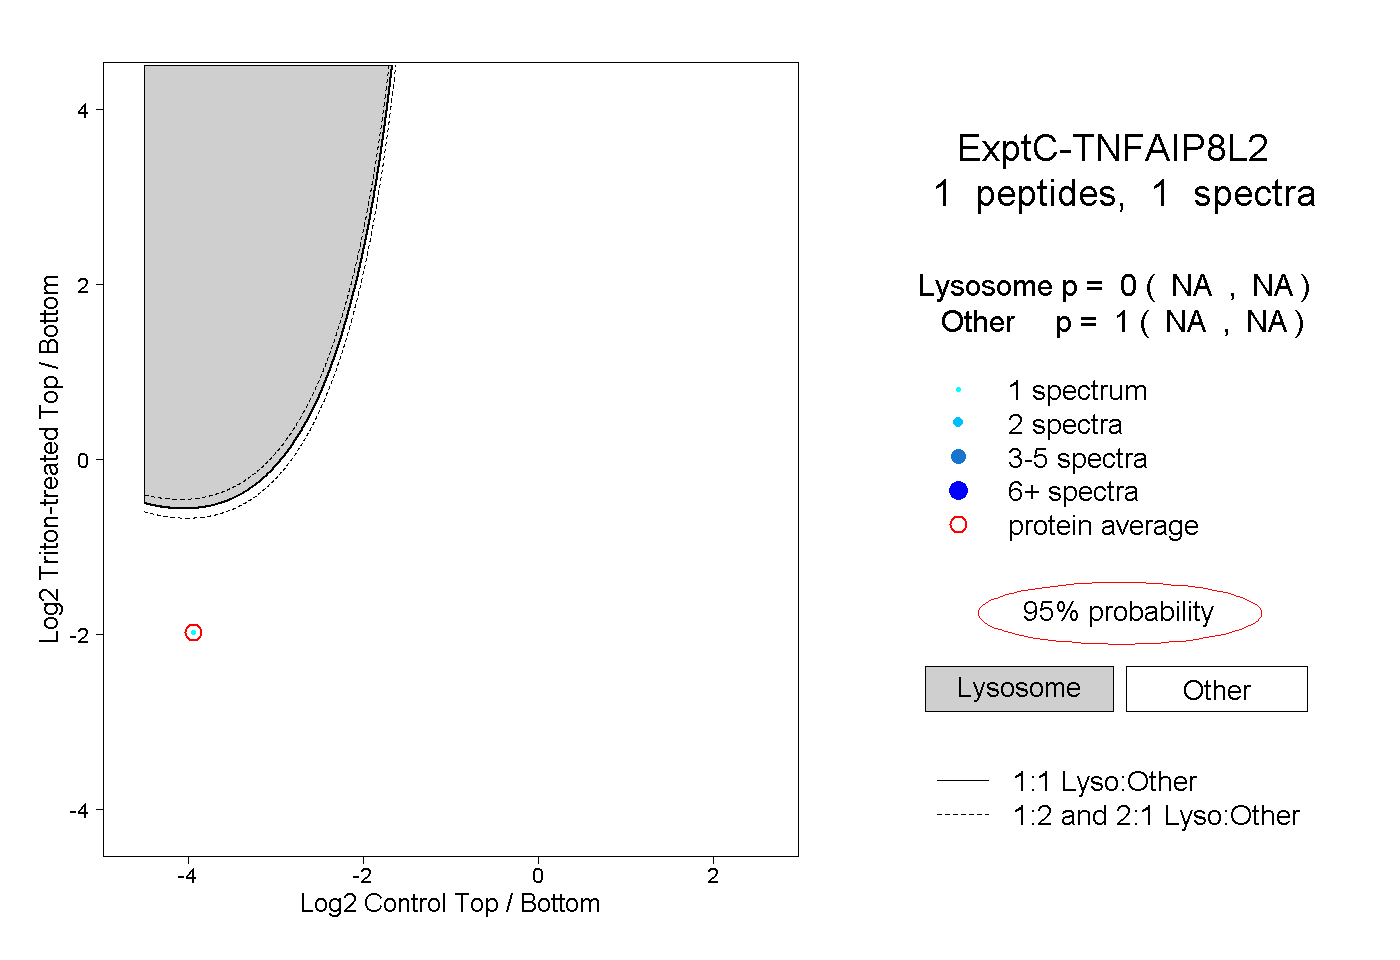 |
0.000 NA | NA |
1.000 NA | NA |