 3
3peptides
spectra
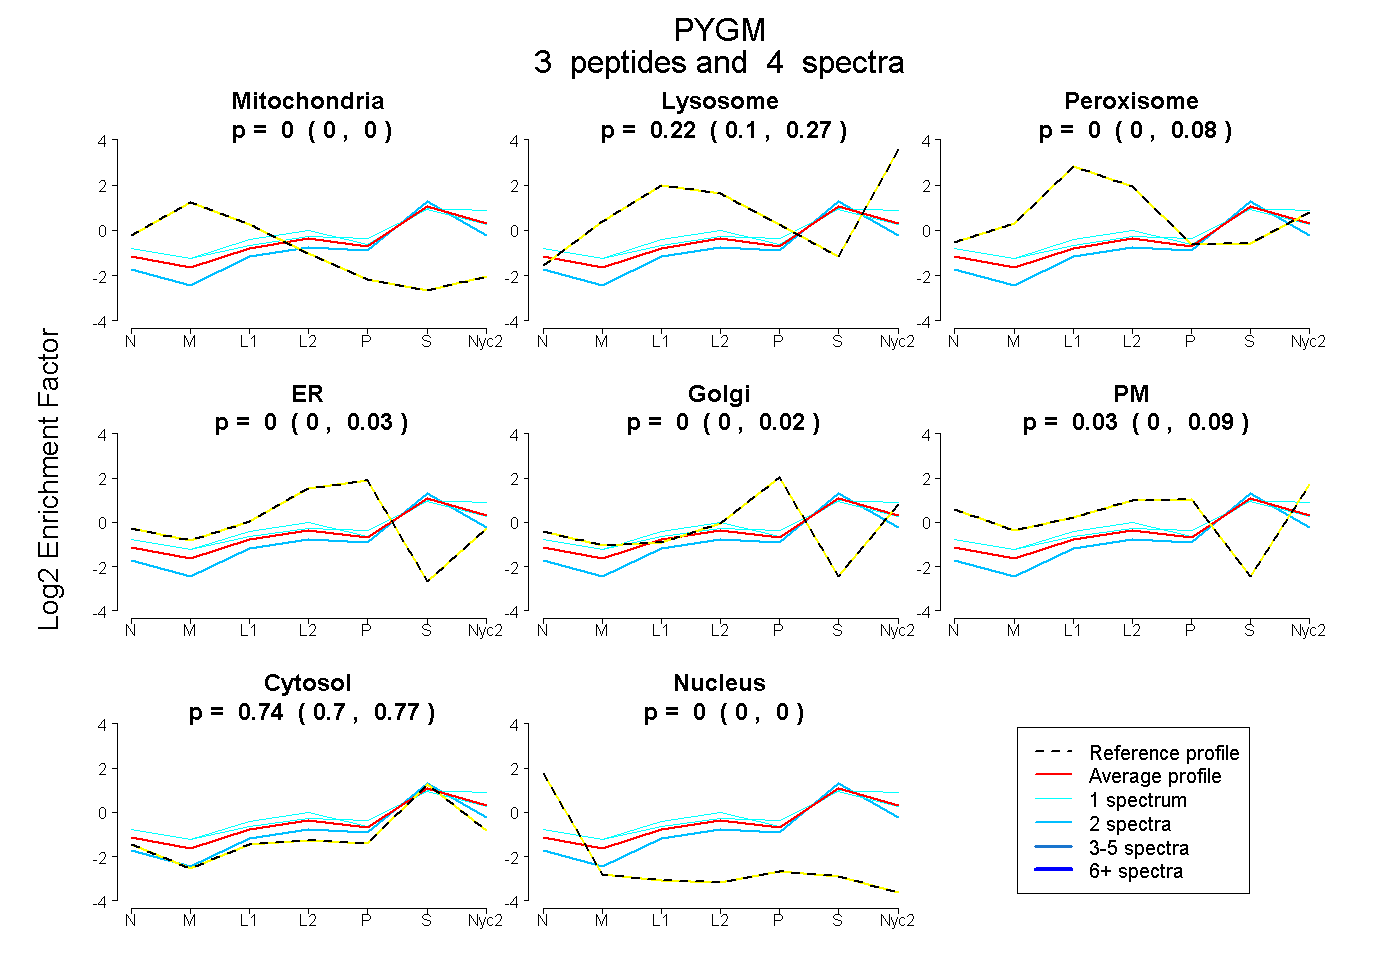
0.000 | 0.000
0.103 | 0.269
0.000 | 0.082
0.000 | 0.028
0.000 | 0.019
0.000 | 0.089
0.701 | 0.768
0.000 | 0.000
1peptide
spectrum
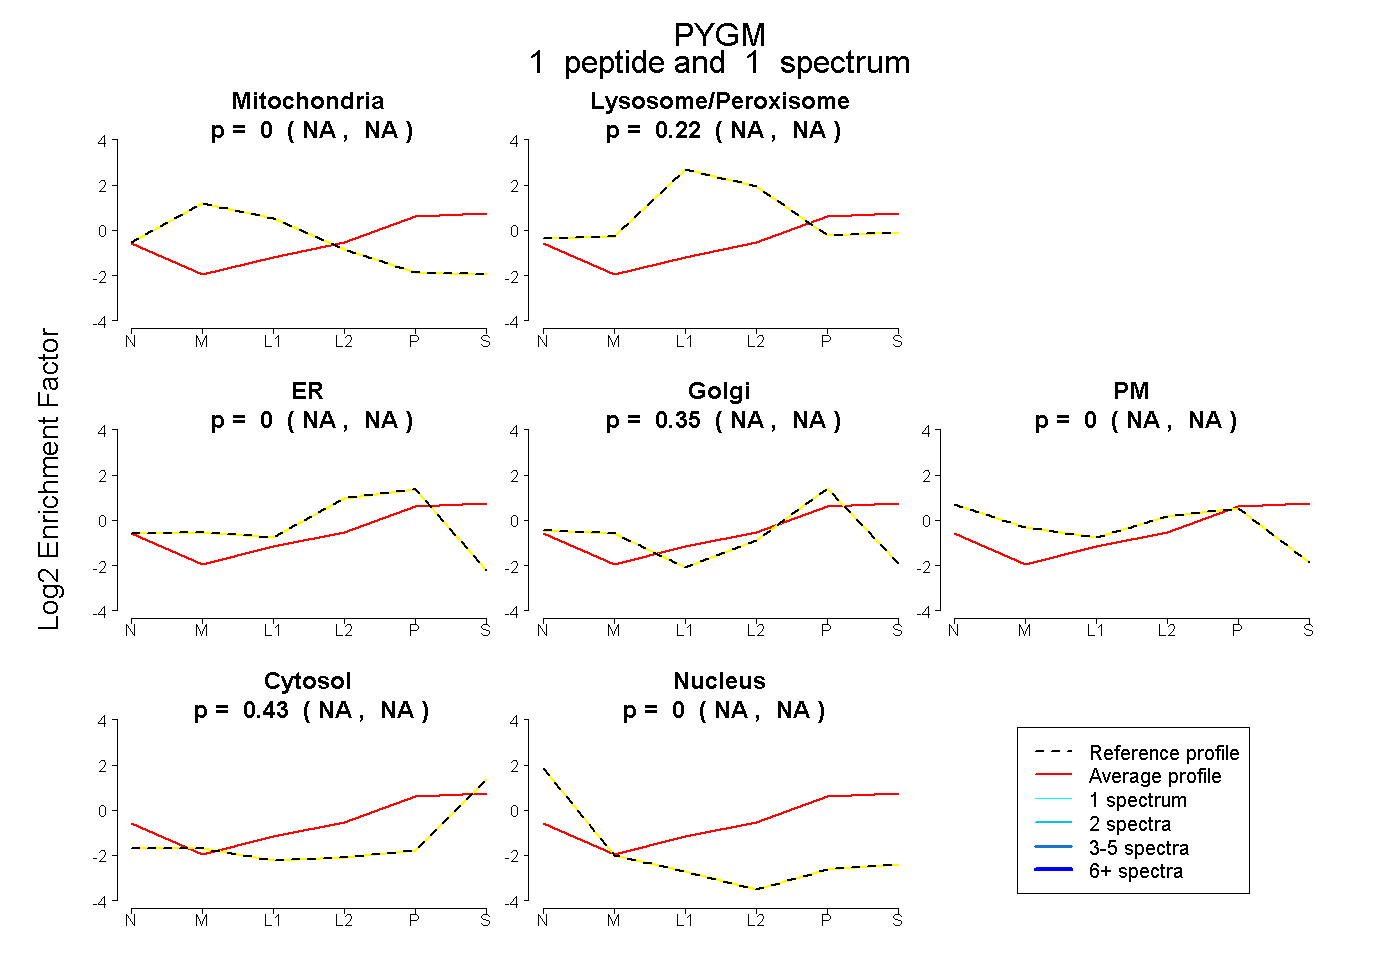
NA | NA
NA | NA
NA | NA
NA | NA
NA | NA
NA | NA
NA | NA
4peptides
spectra
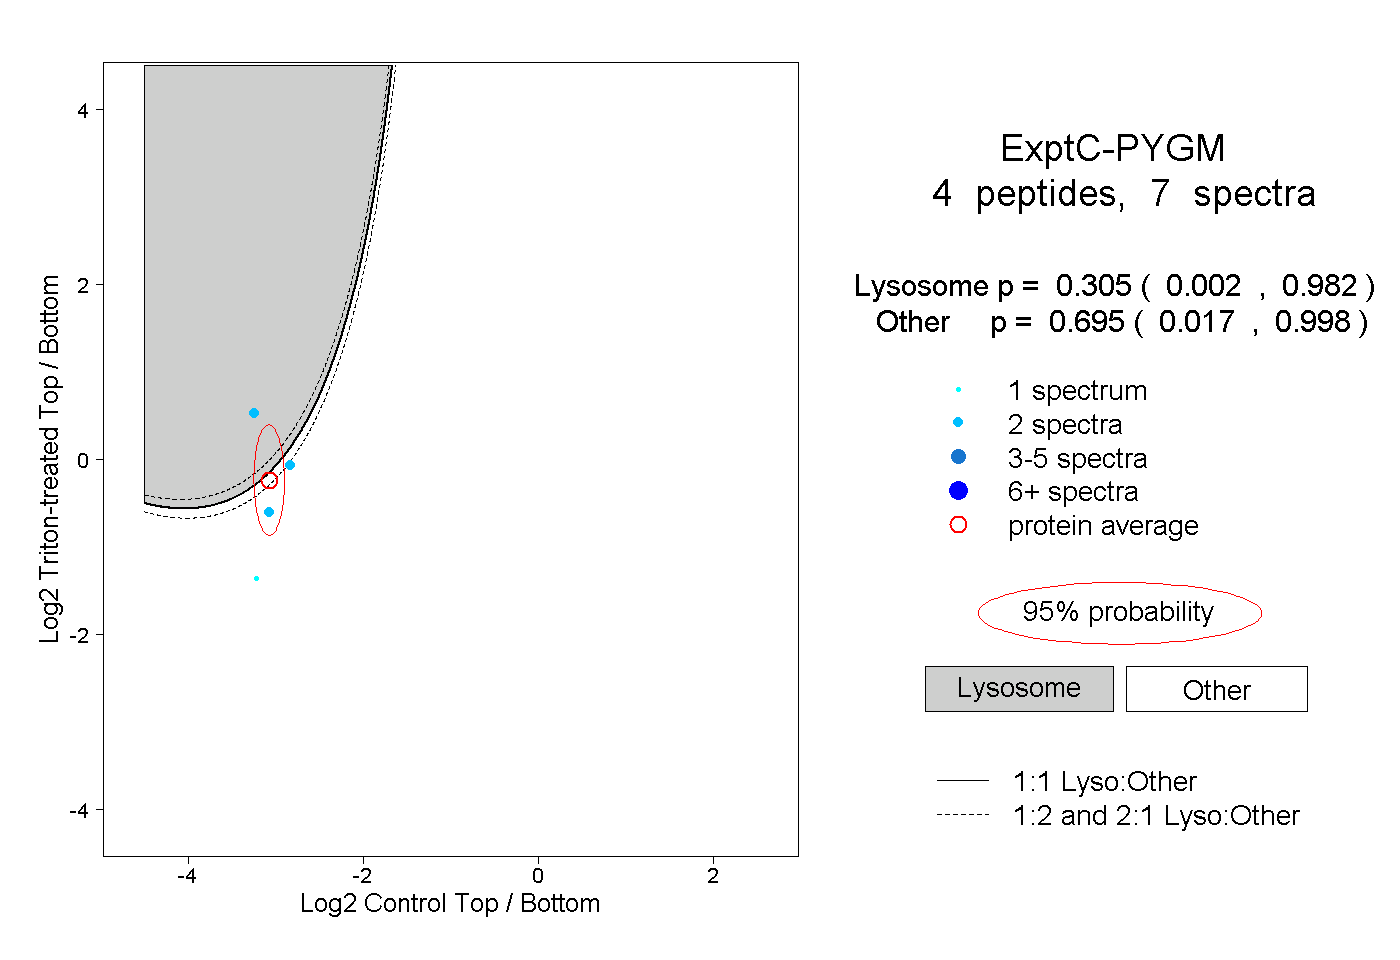
0.002 | 0.982
0.017 | 0.998