 1
1peptide
spectra
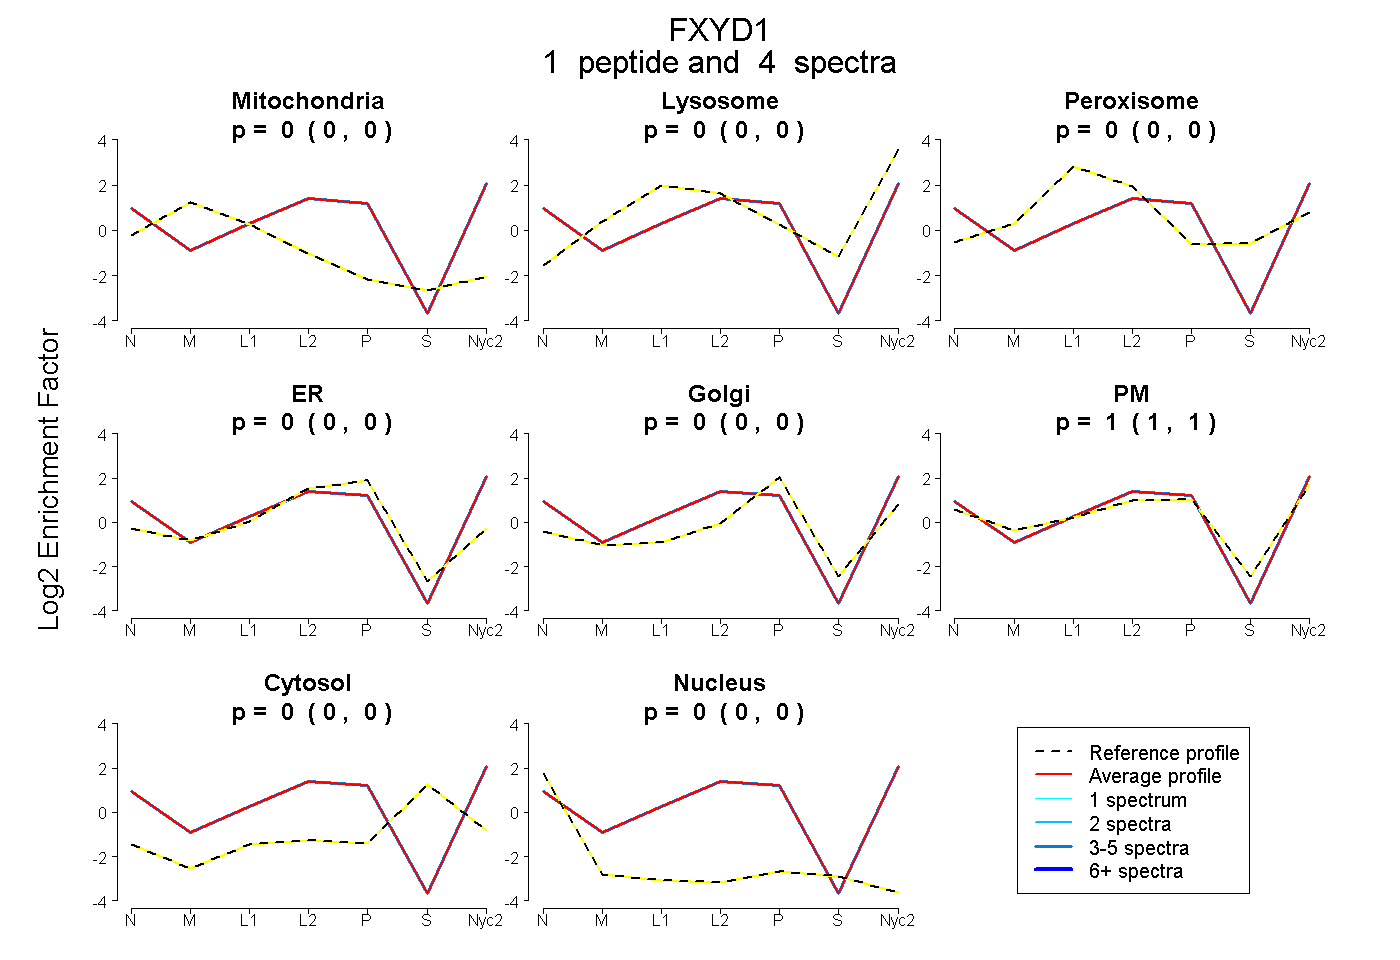
0.000 | 0.000
0.000 | 0.000
0.000 | 0.000
0.000 | 0.000
0.000 | 0.000
1.000 | 1.000
0.000 | 0.000
0.000 | 0.000
1peptide
spectra
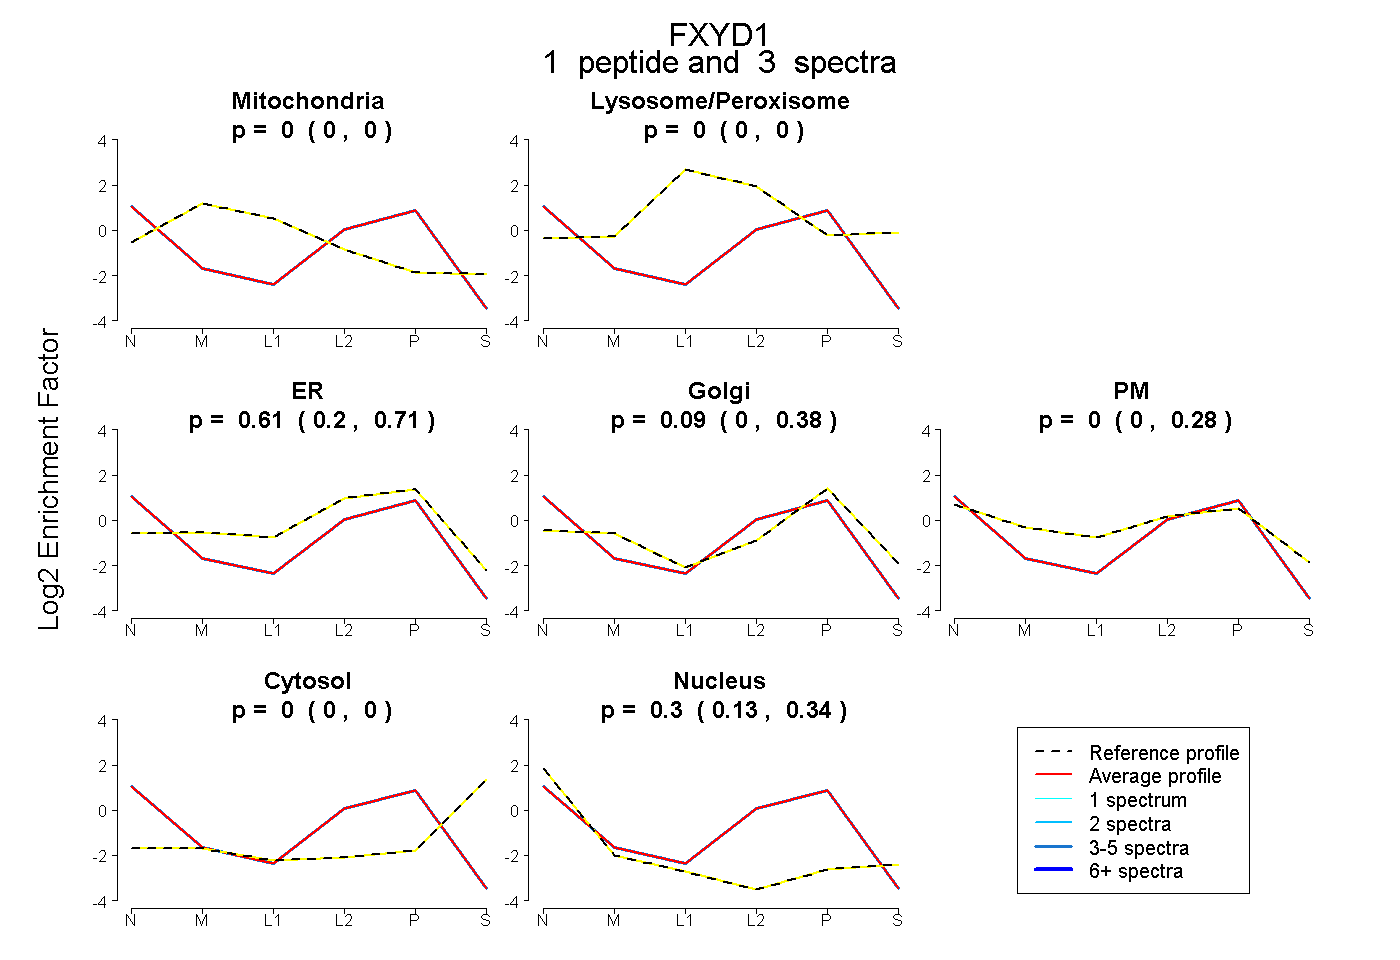
0.000 | 0.000
0.000 | 0.000
0.196 | 0.712
0.000 | 0.385
0.000 | 0.280
0.000 | 0.000
0.132 | 0.340
2peptides
spectra
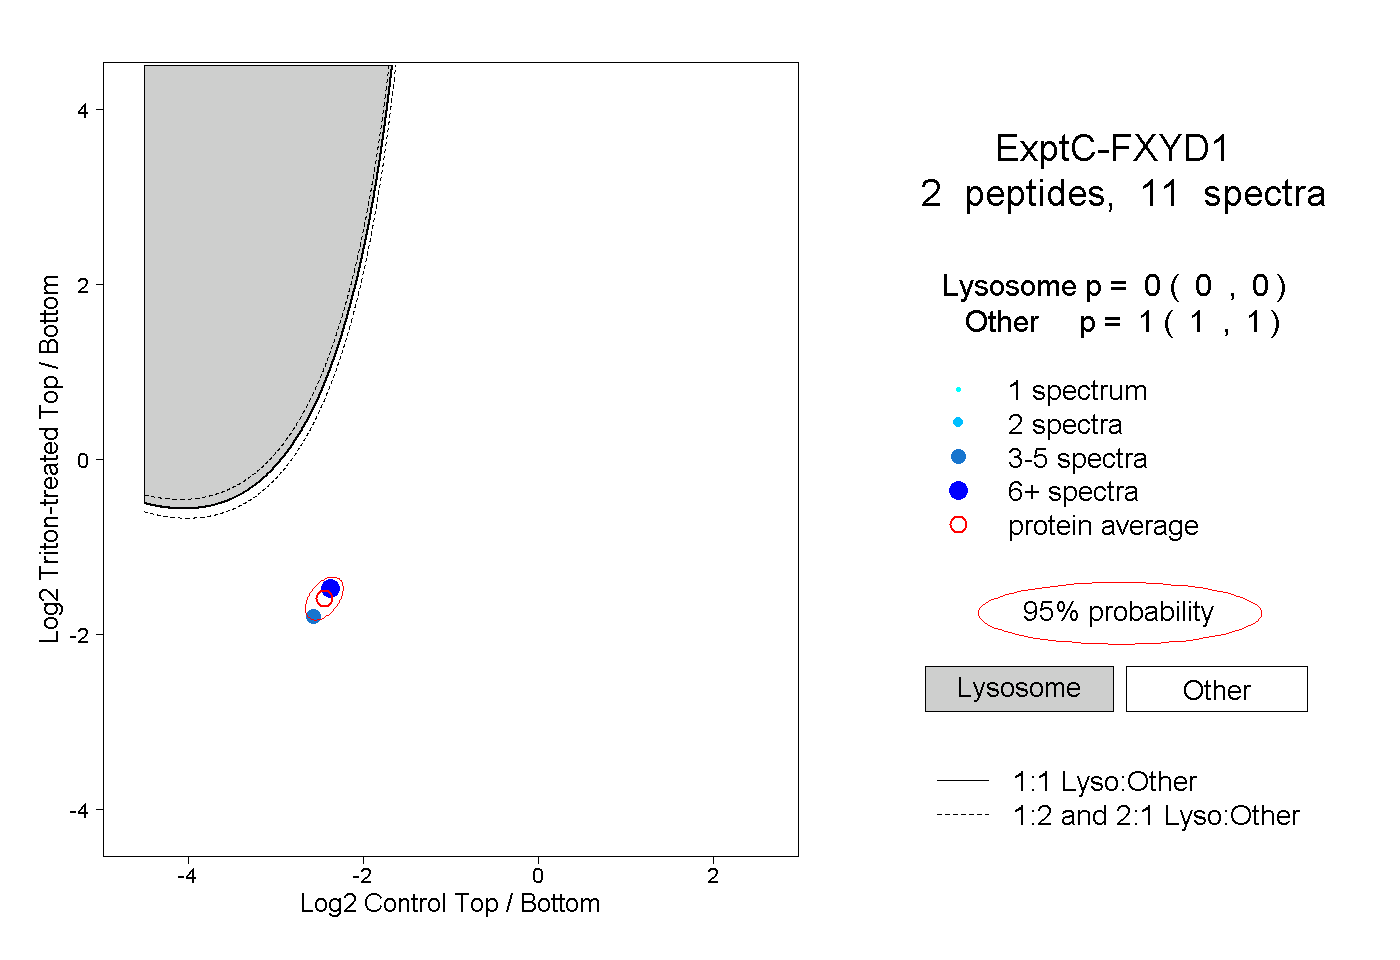
0.000 | 0.000
1.000 | 1.000
1peptide
spectra
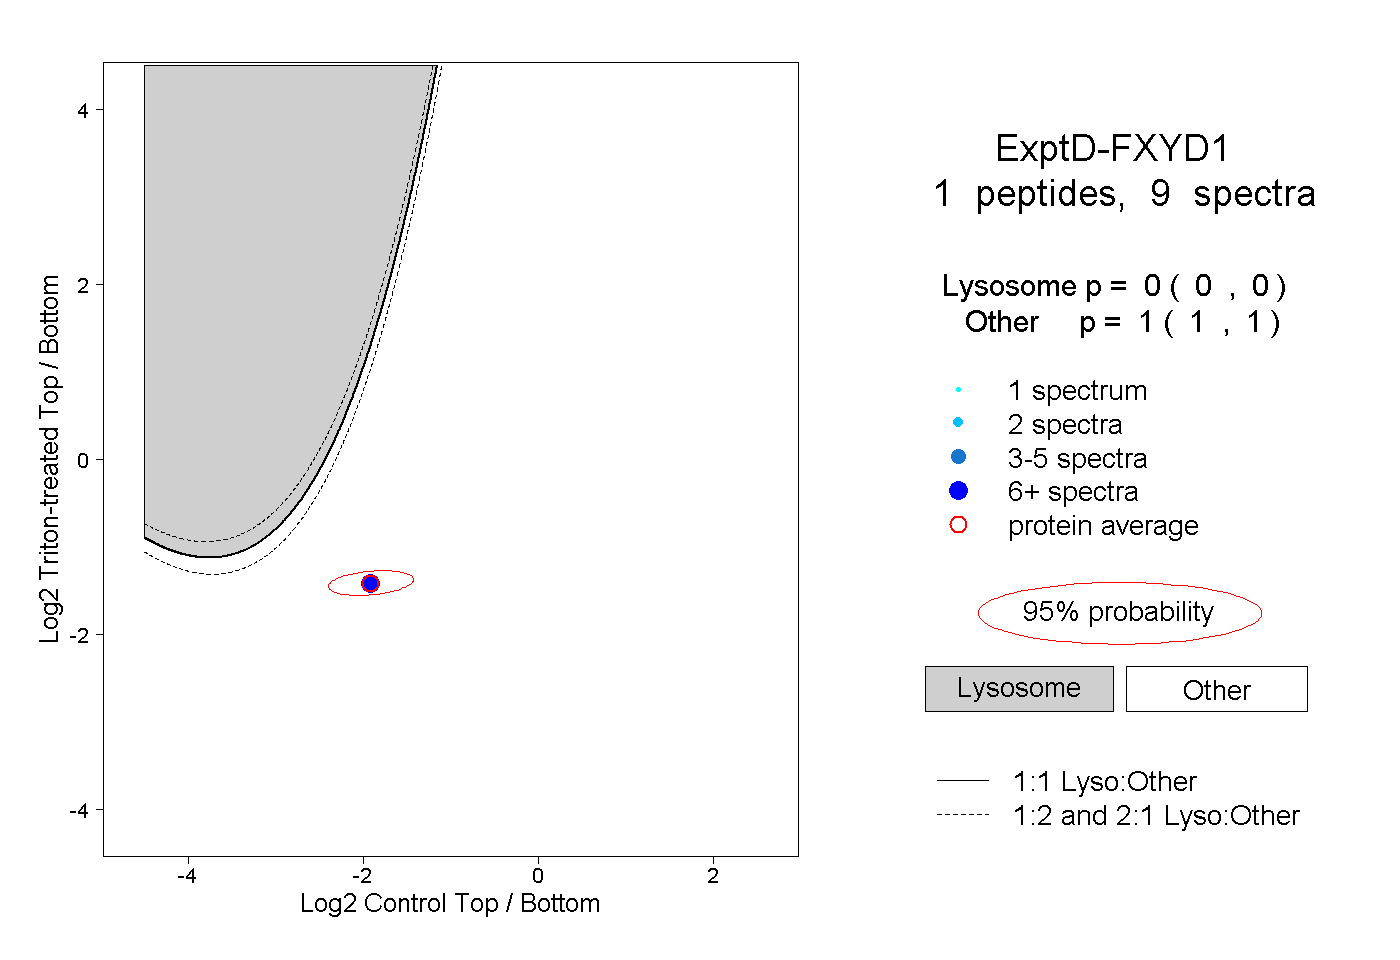
0.000 | 0.000
1.000 | 1.000