 2
2peptides
spectra
0.000 | 0.052
0.000 | 0.233
0.000 | 0.000
0.000 | 0.059
0.195 | 0.533
0.309 | 0.524
0.000 | 0.117
1peptide
spectrum
NA | NA
NA | NA
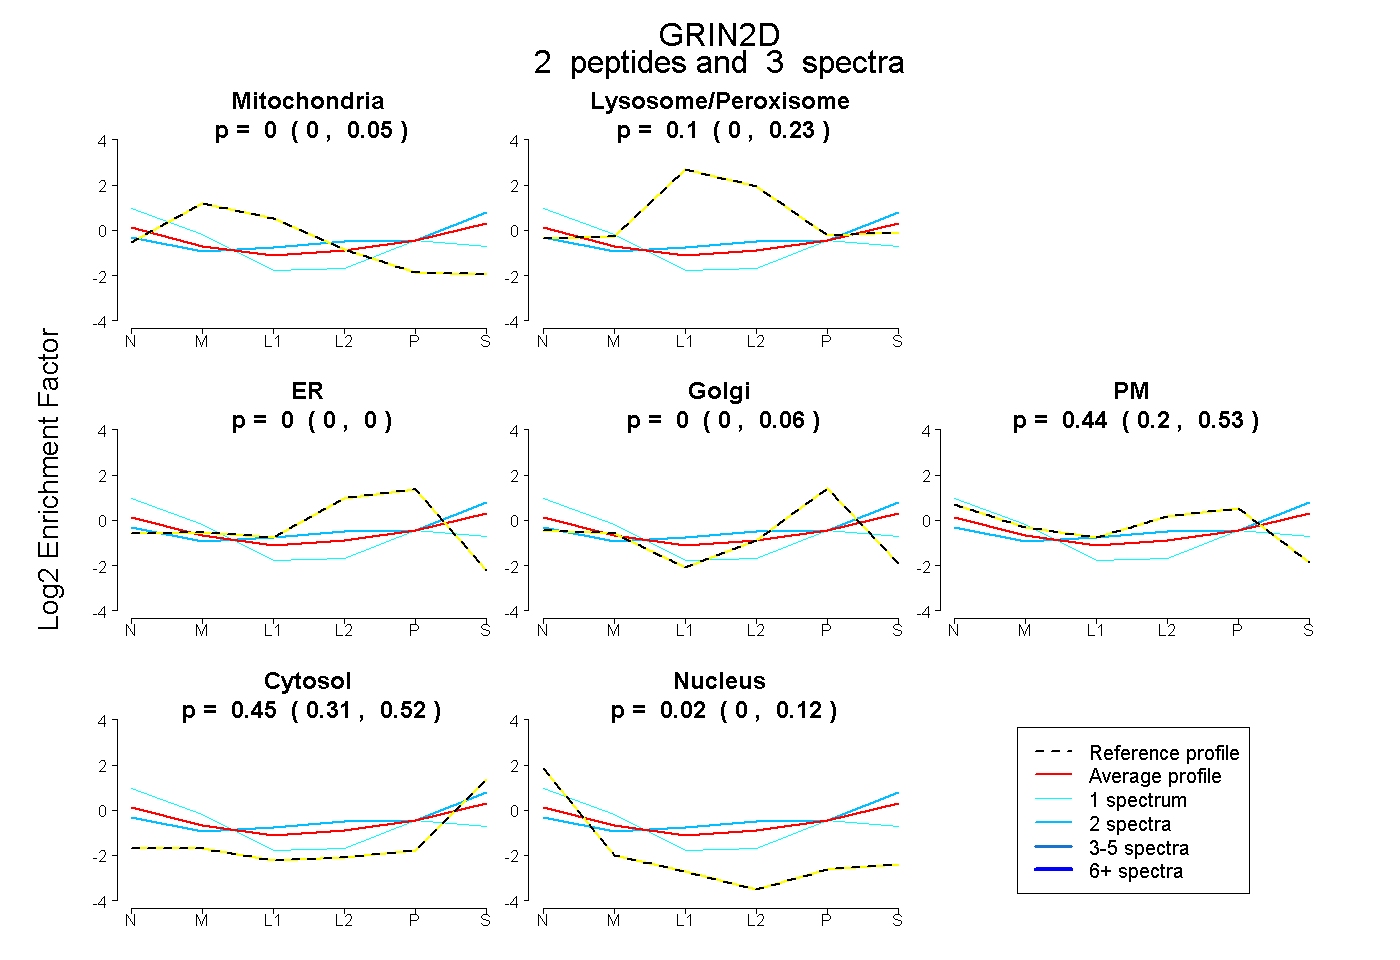
| Plot | Mito | Lyso or Perox | ER | Golgi | PM | Cytosol | Nucleus | ||||||
| Expt B |
2 peptides |
3 spectra |
|
0.000 0.000 | 0.052 |
0.097 0.000 | 0.233 |
0.000 0.000 | 0.000 |
0.000 0.000 | 0.059 |
0.441 0.195 | 0.533 |
0.447 0.309 | 0.524 |
0.015 0.000 | 0.117 |
|||
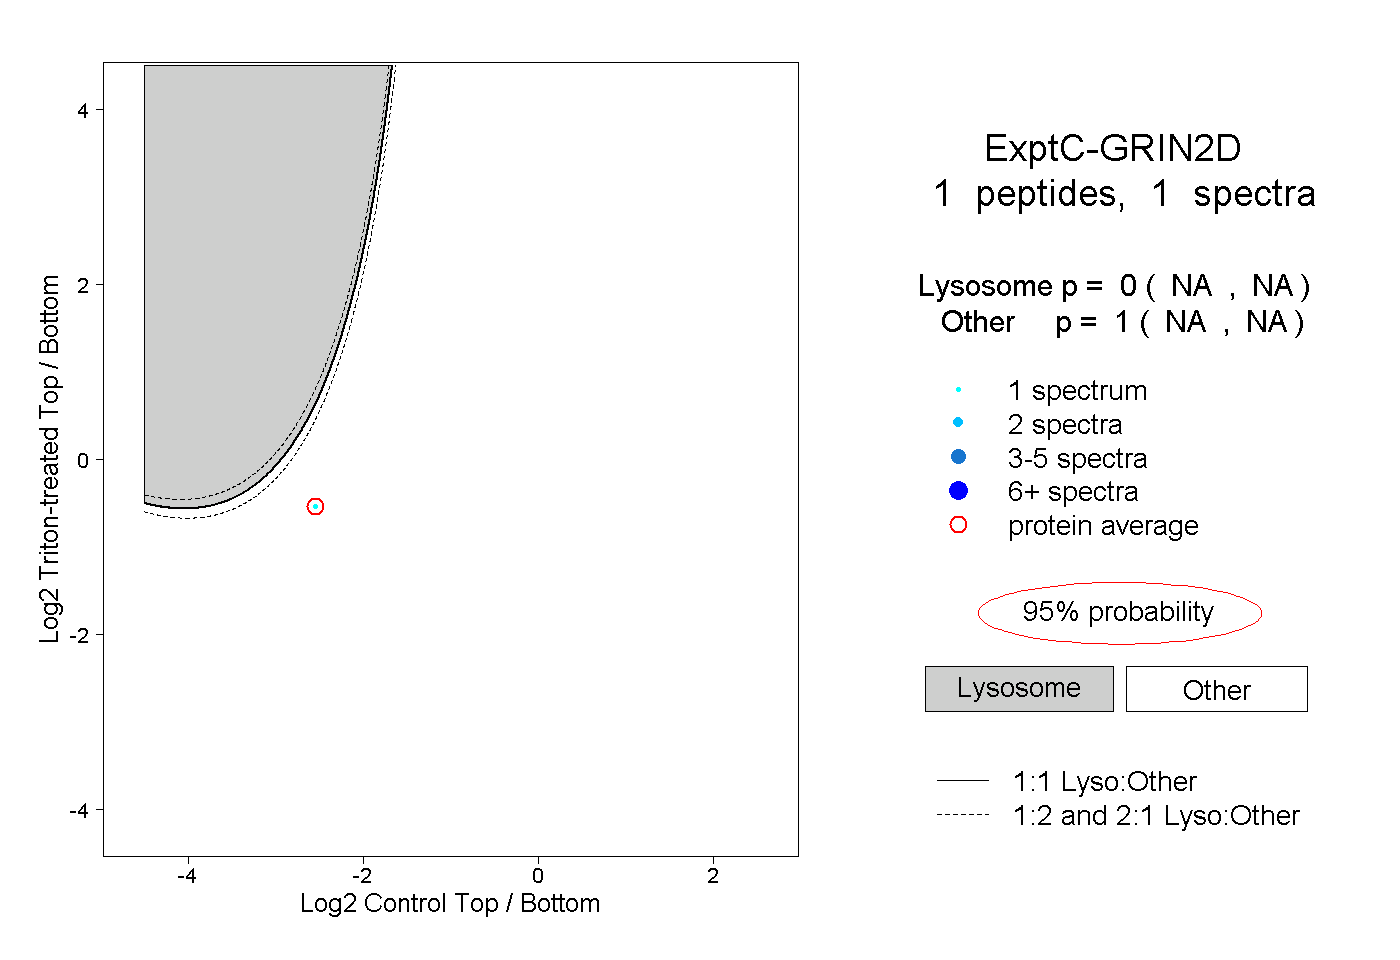
| Plot | Lyso | Other | |||||||||||
| Expt C |
1 peptide |
1 spectrum |
|
0.000 NA | NA |
1.000 NA | NA |