 6
6peptides
spectra
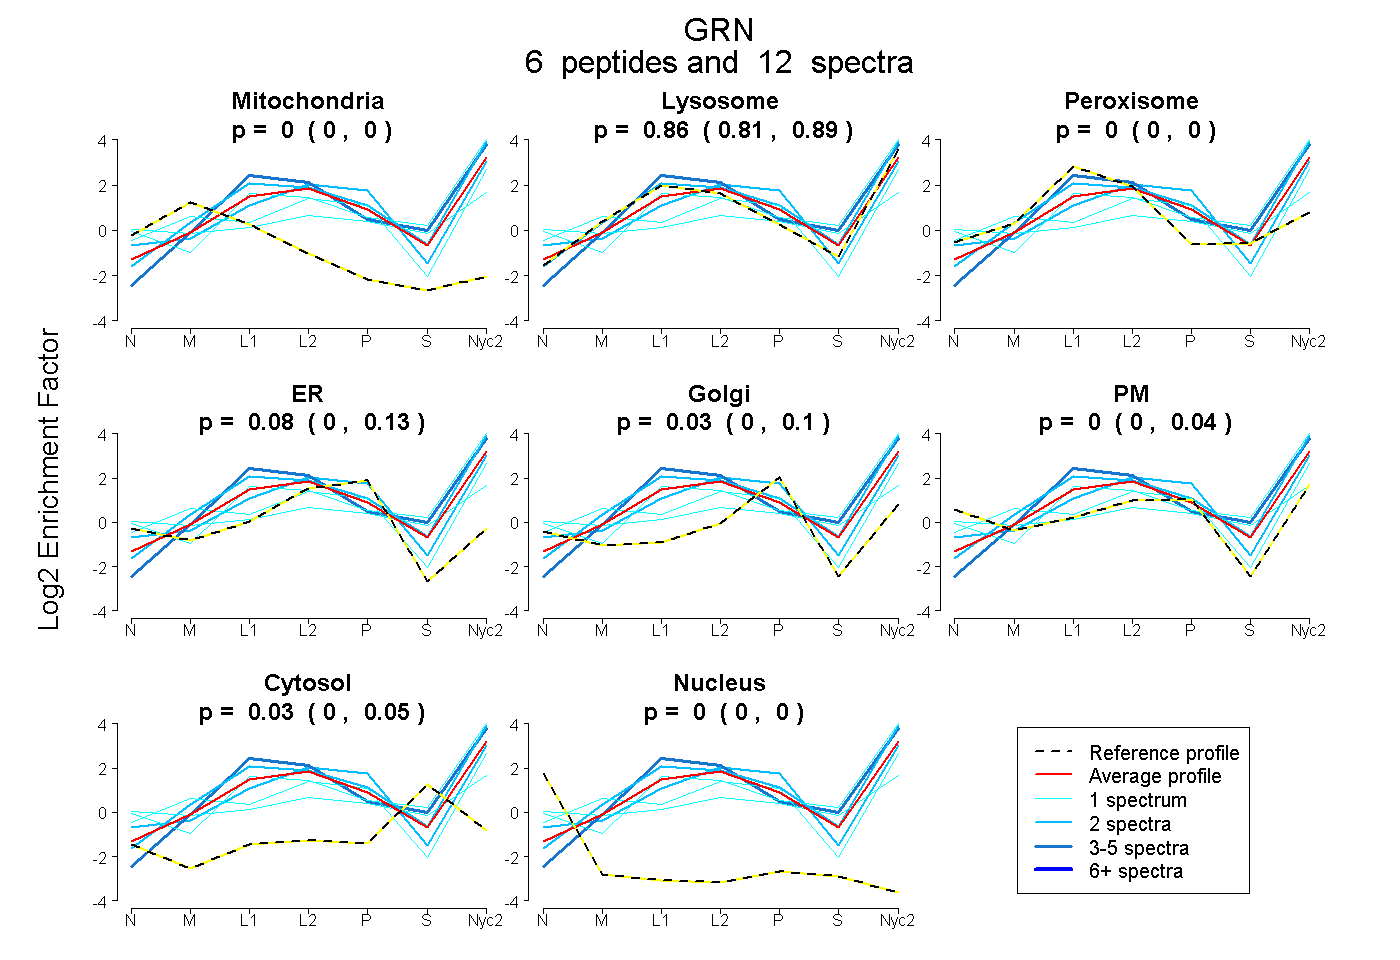
0.000 | 0.000
0.811 | 0.892
0.000 | 0.000
0.000 | 0.128
0.000 | 0.100
0.000 | 0.044
0.001 | 0.054
0.000 | 0.000
3peptides
spectra
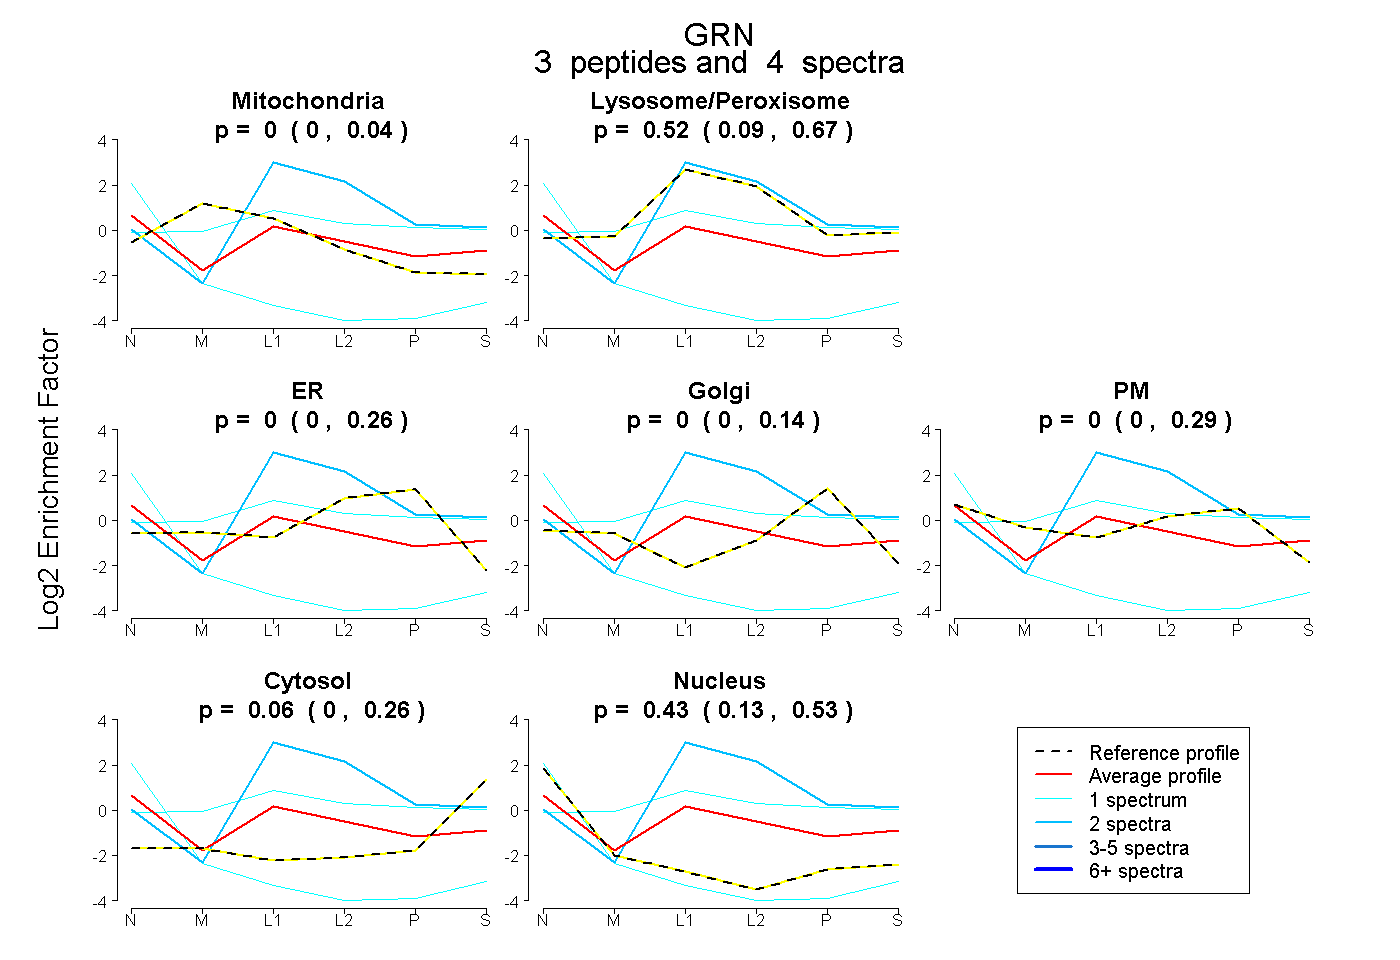
0.000 | 0.041
0.089 | 0.666
0.000 | 0.257
0.000 | 0.137
0.000 | 0.294
0.000 | 0.258
0.129 | 0.532
14peptides
spectra
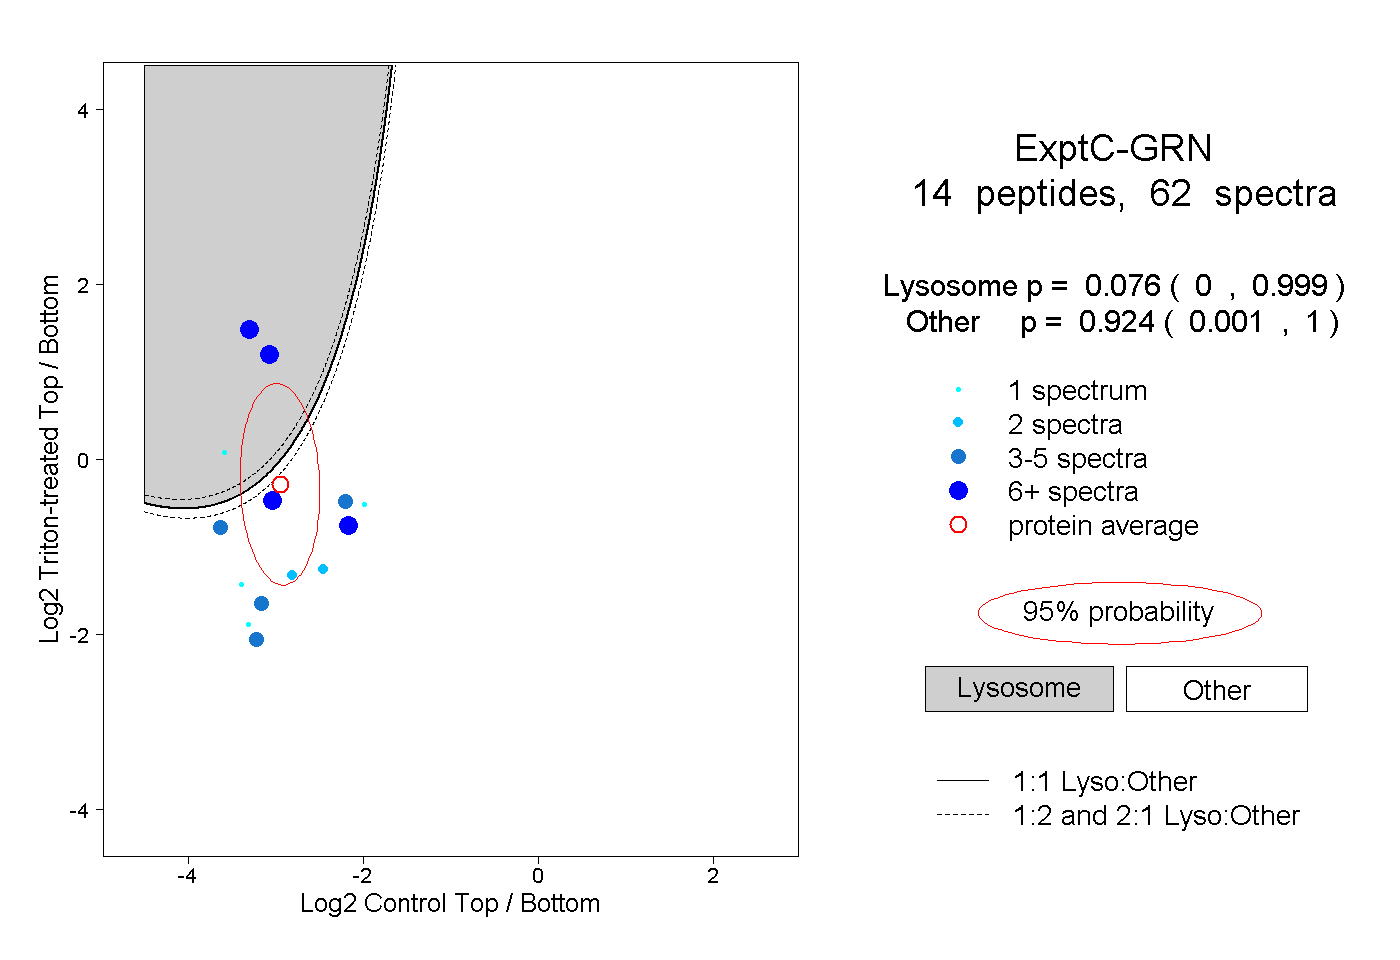
0.000 | 0.999
0.001 | 1.000