5
5peptides
spectra
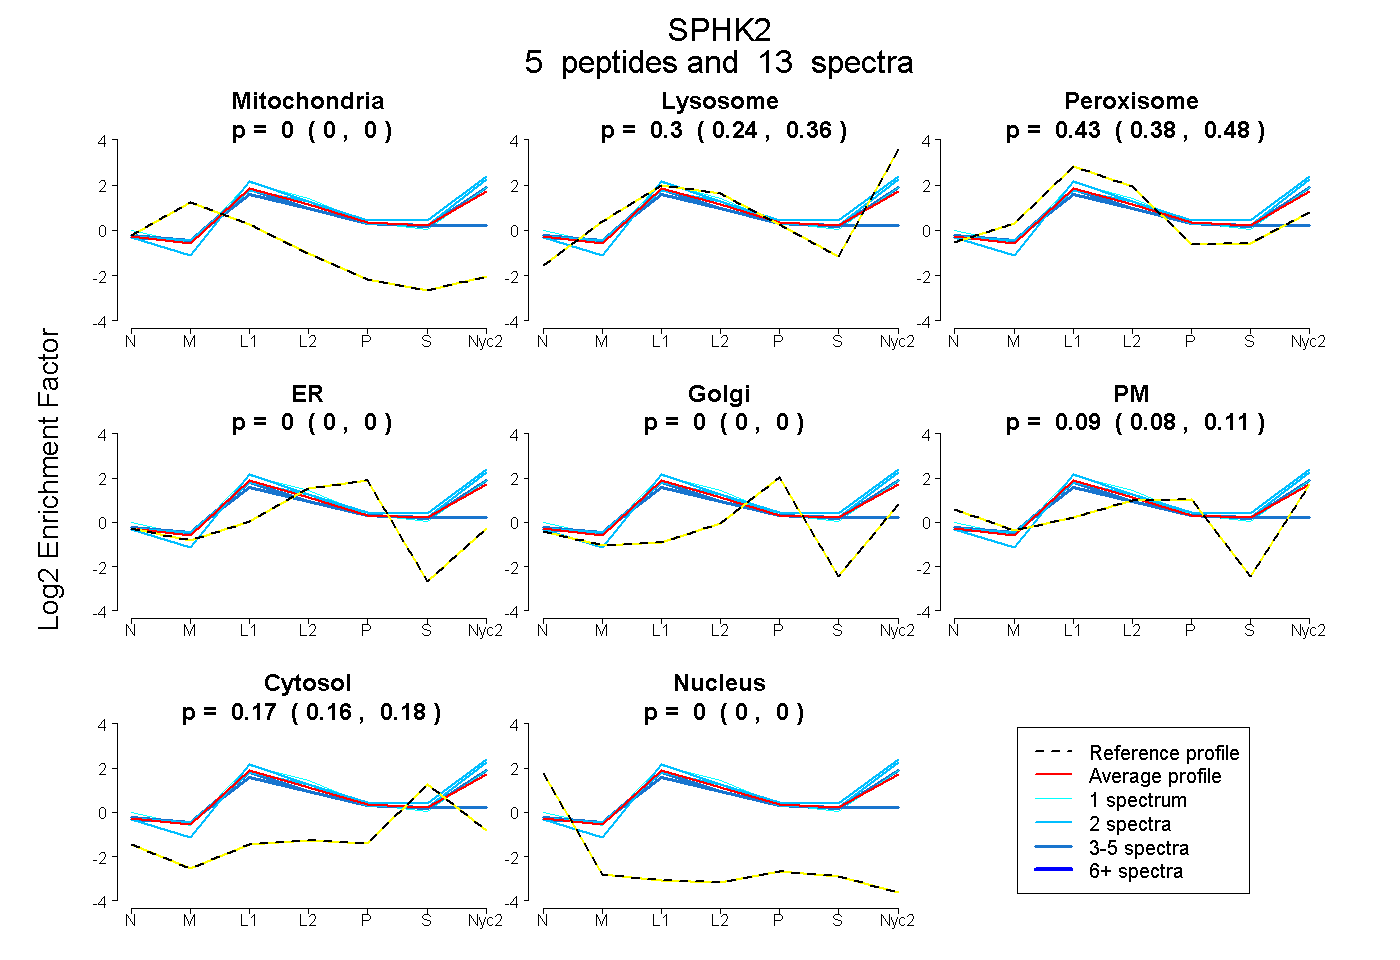
0.000 | 0.000
0.235 | 0.355
0.381 | 0.478
0.000 | 0.000
0.000 | 0.000
0.080 | 0.106
0.162 | 0.178
0.000 | 0.000
5peptides
spectra
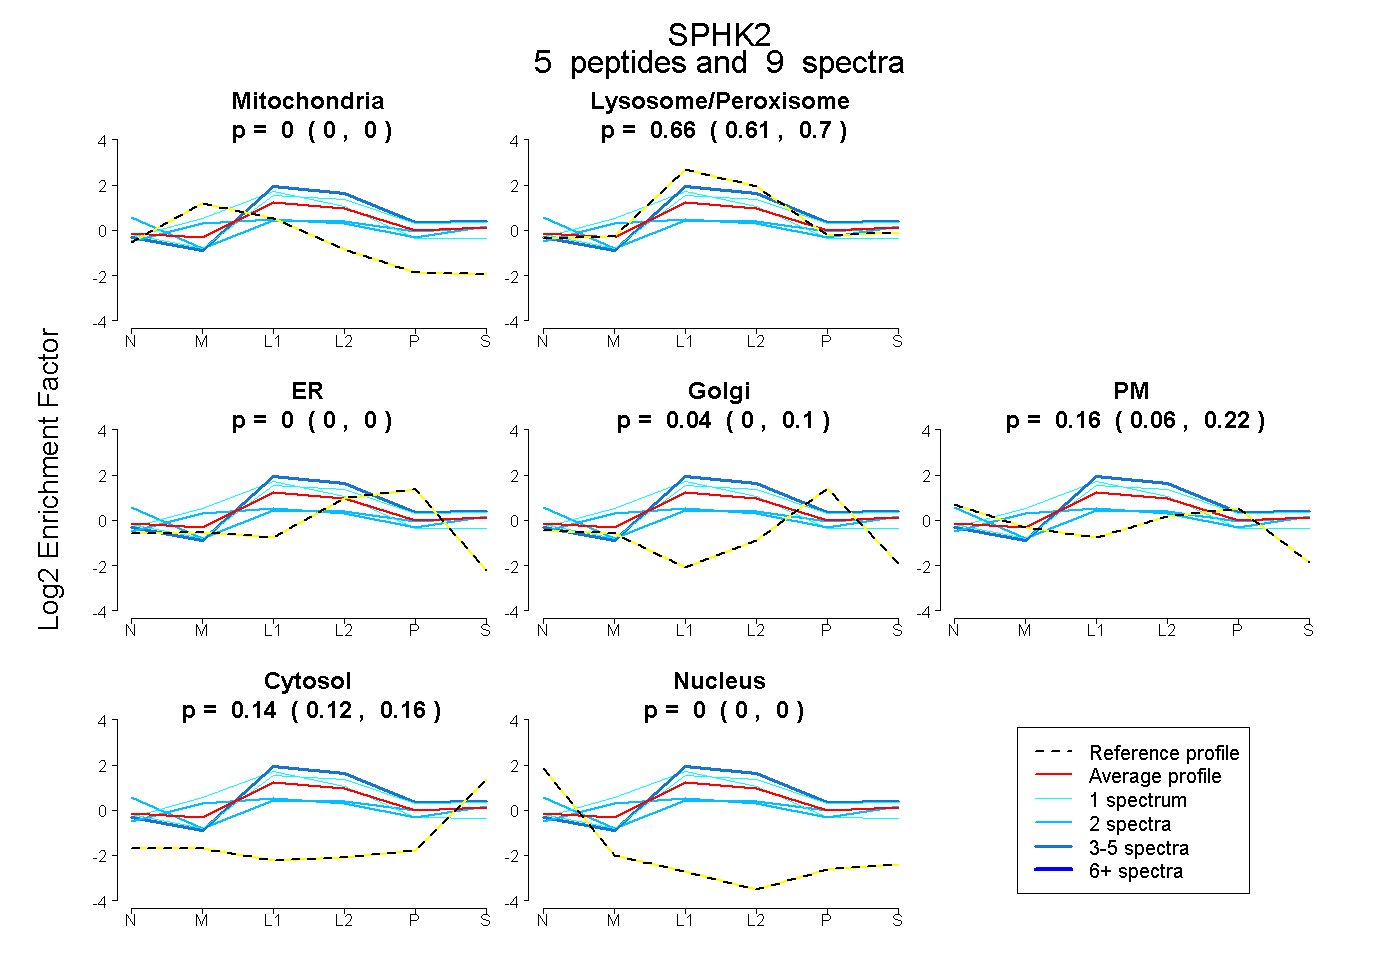
0.000 | 0.000
0.614 | 0.703
0.000 | 0.000
0.000 | 0.102
0.057 | 0.217
0.117 | 0.165
0.000 | 0.000