 5
5peptides
spectra
0.000 | 0.000
0.235 | 0.355
0.381 | 0.478
0.000 | 0.000
0.000 | 0.000
0.080 | 0.106
0.162 | 0.178
0.000 | 0.000
| Plot | Mito | Lyso | Perox | ER | Golgi | PM | Cytosol | Nucleus | |||||
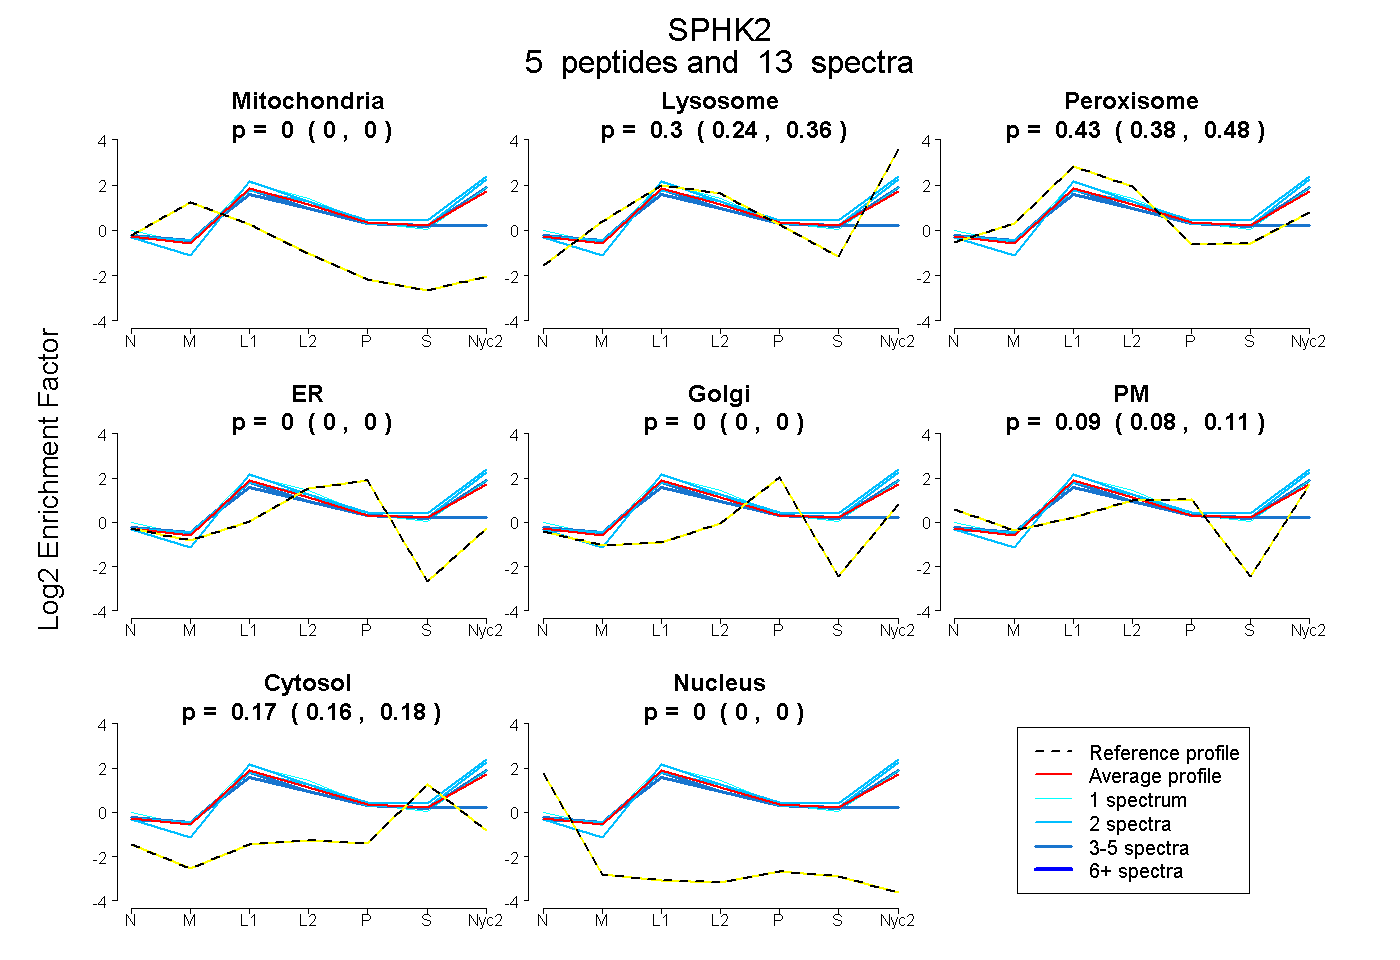
| Expt A |
5 peptides |
13 spectra |
|
0.000 0.000 | 0.000 |
0.303 0.235 | 0.355 |
0.432 0.381 | 0.478 |
0.000 0.000 | 0.000 |
0.000 0.000 | 0.000 |
0.094 0.080 | 0.106 |
0.171 0.162 | 0.178 |
0.000 0.000 | 0.000 |
| 2 spectra, LEPLTPR | 0.000 | 0.459 | 0.316 | 0.000 | 0.000 | 0.073 | 0.153 | 0.000 | ||
| 2 spectra, GLAWQR | 0.000 | 0.504 | 0.313 | 0.000 | 0.000 | 0.007 | 0.176 | 0.000 | ||
| 4 spectra, ADGAATYVENR | 0.000 | 0.381 | 0.311 | 0.000 | 0.000 | 0.111 | 0.197 | 0.000 | ||
| 4 spectra, FDDGVVHLCWVR | 0.000 | 0.000 | 0.668 | 0.056 | 0.078 | 0.000 | 0.197 | 0.000 | ||
| 1 spectrum, DGLVPLDEVSGCGTLQSR | 0.000 | 0.272 | 0.489 | 0.000 | 0.000 | 0.142 | 0.098 | 0.000 |
| Plot | Mito | Lyso or Perox | ER | Golgi | PM | Cytosol | Nucleus | ||||||
| Expt B |
5 peptides |
9 spectra |
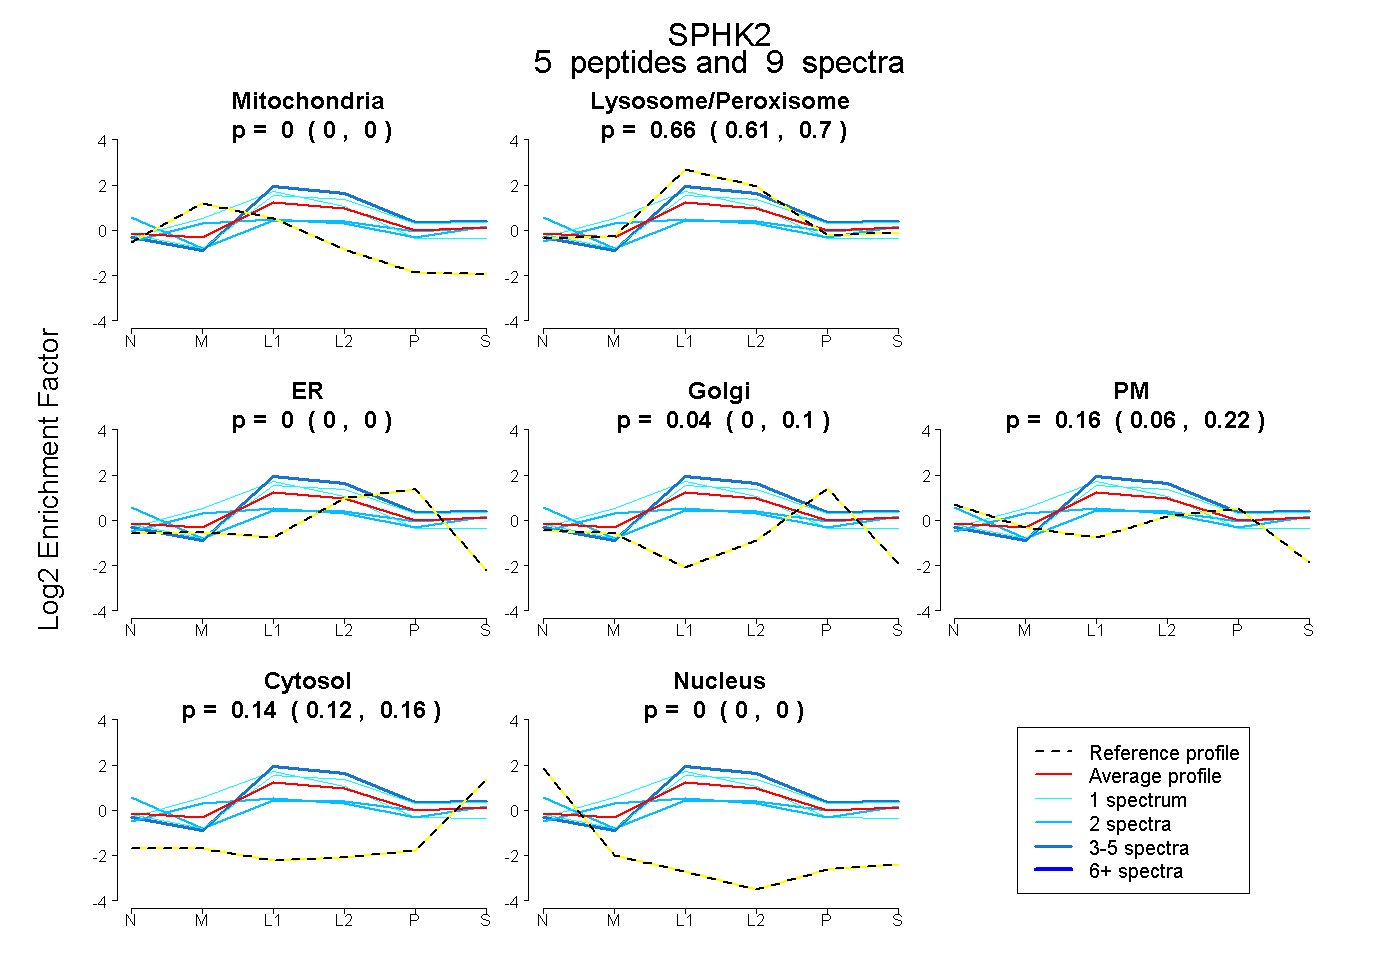 |
0.000 0.000 | 0.000 |
0.662 0.614 | 0.703 |
0.000 0.000 | 0.000 |
0.038 0.000 | 0.102 |
0.155 0.057 | 0.217 |
0.145 0.117 | 0.165 |
0.000 0.000 | 0.000 |
|||
| Plot | Lyso | Other | |||||||||||
| Expt C |
9 peptides |
51 spectra |
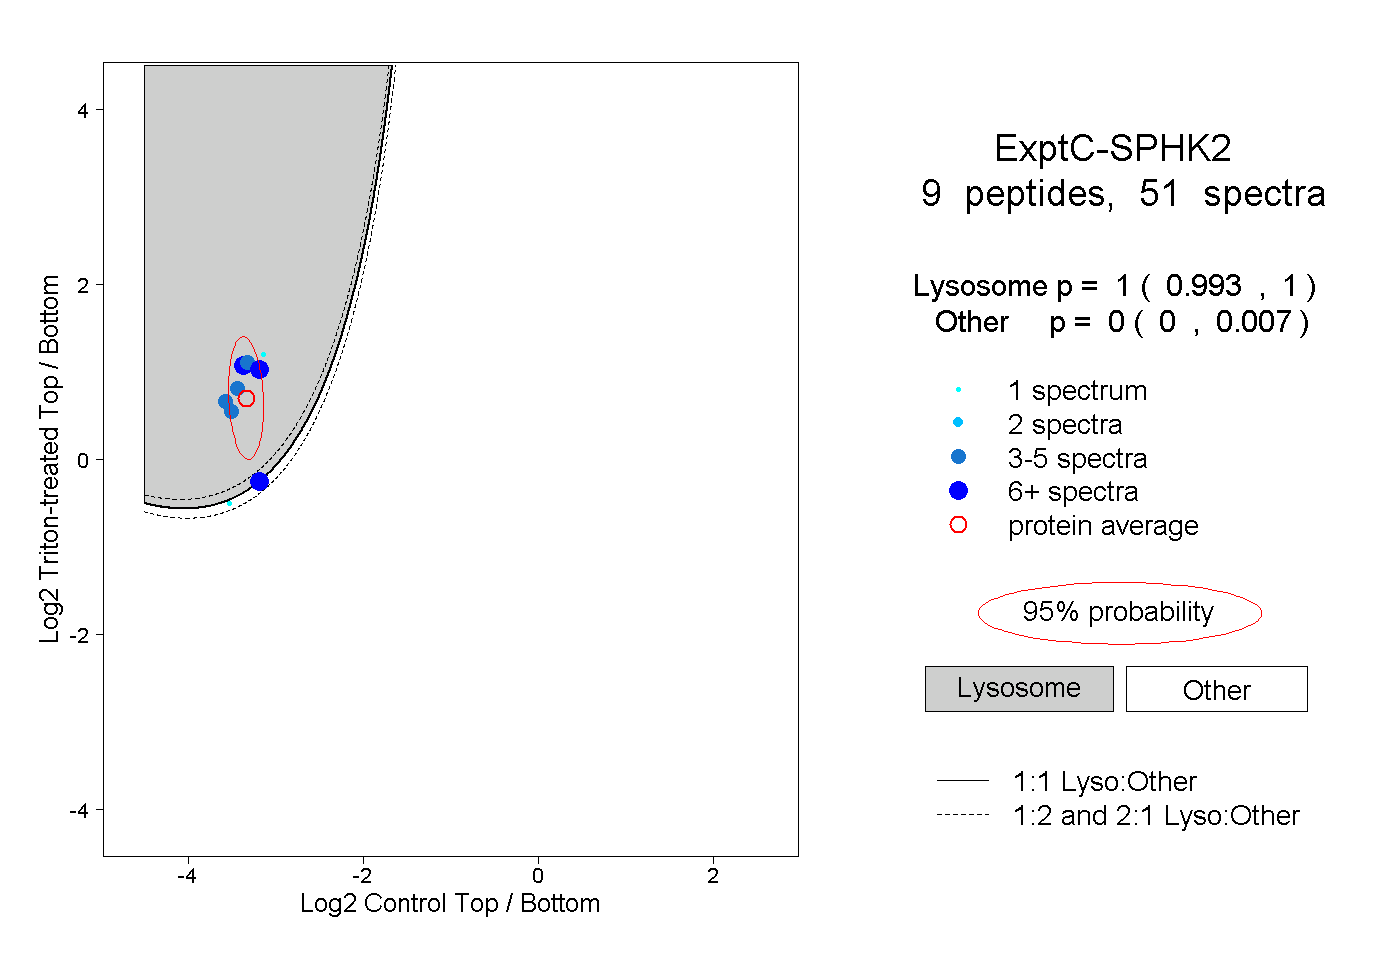 |
1.000 0.993 | 1.000 |
0.000 0.000 | 0.007 |
||||||||
| Plot | Lyso | Other | |||||||||||
| Expt D |
2 peptides |
4 spectra |
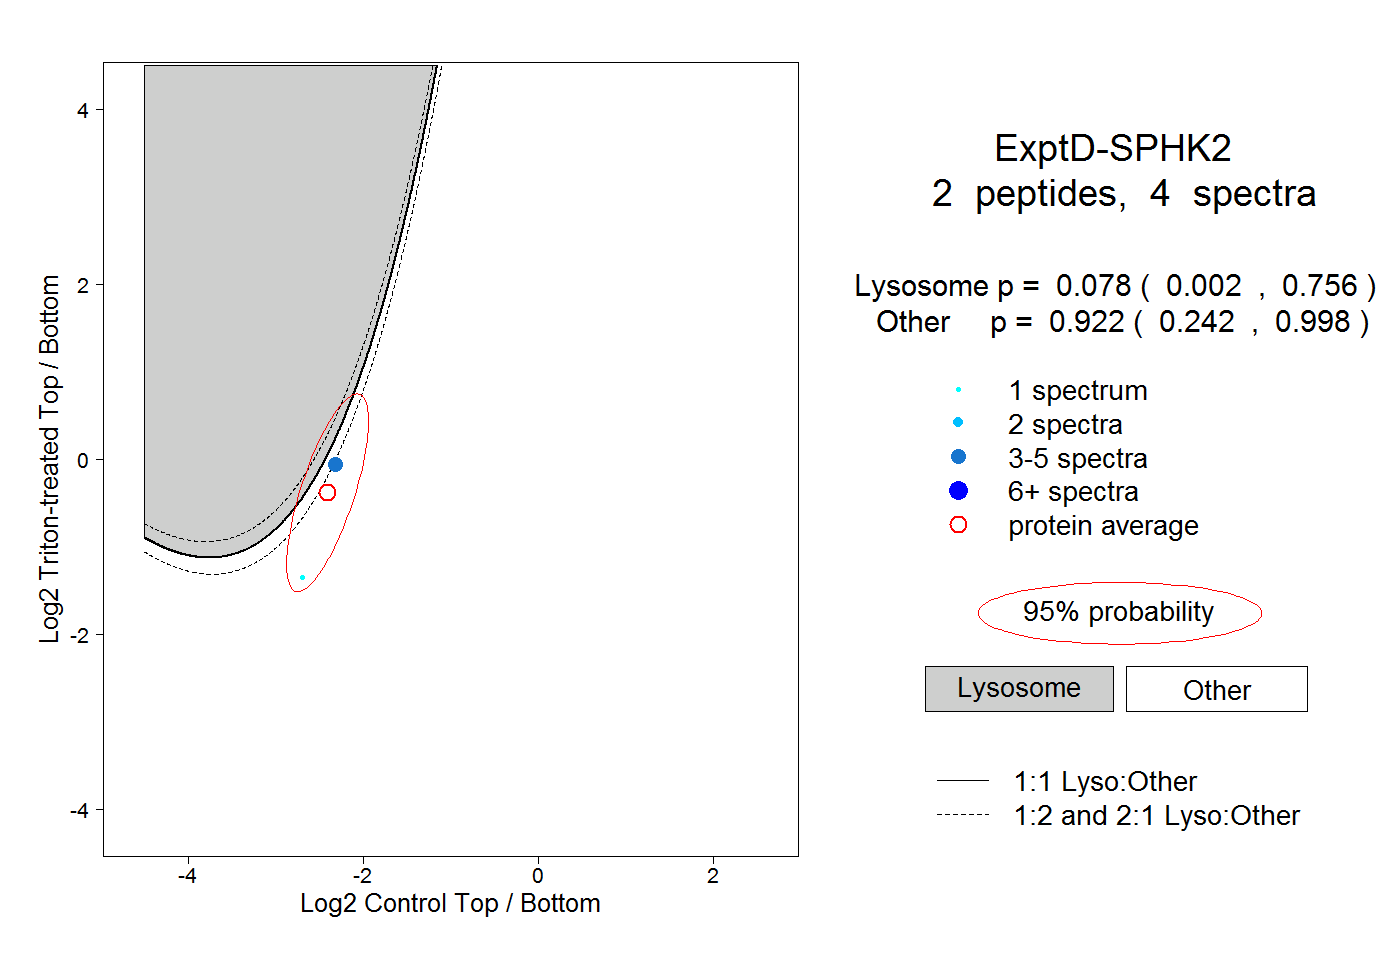 |
0.078 0.002 | 0.756 |
0.922 0.242 | 0.998 |