 2
2peptides
spectra
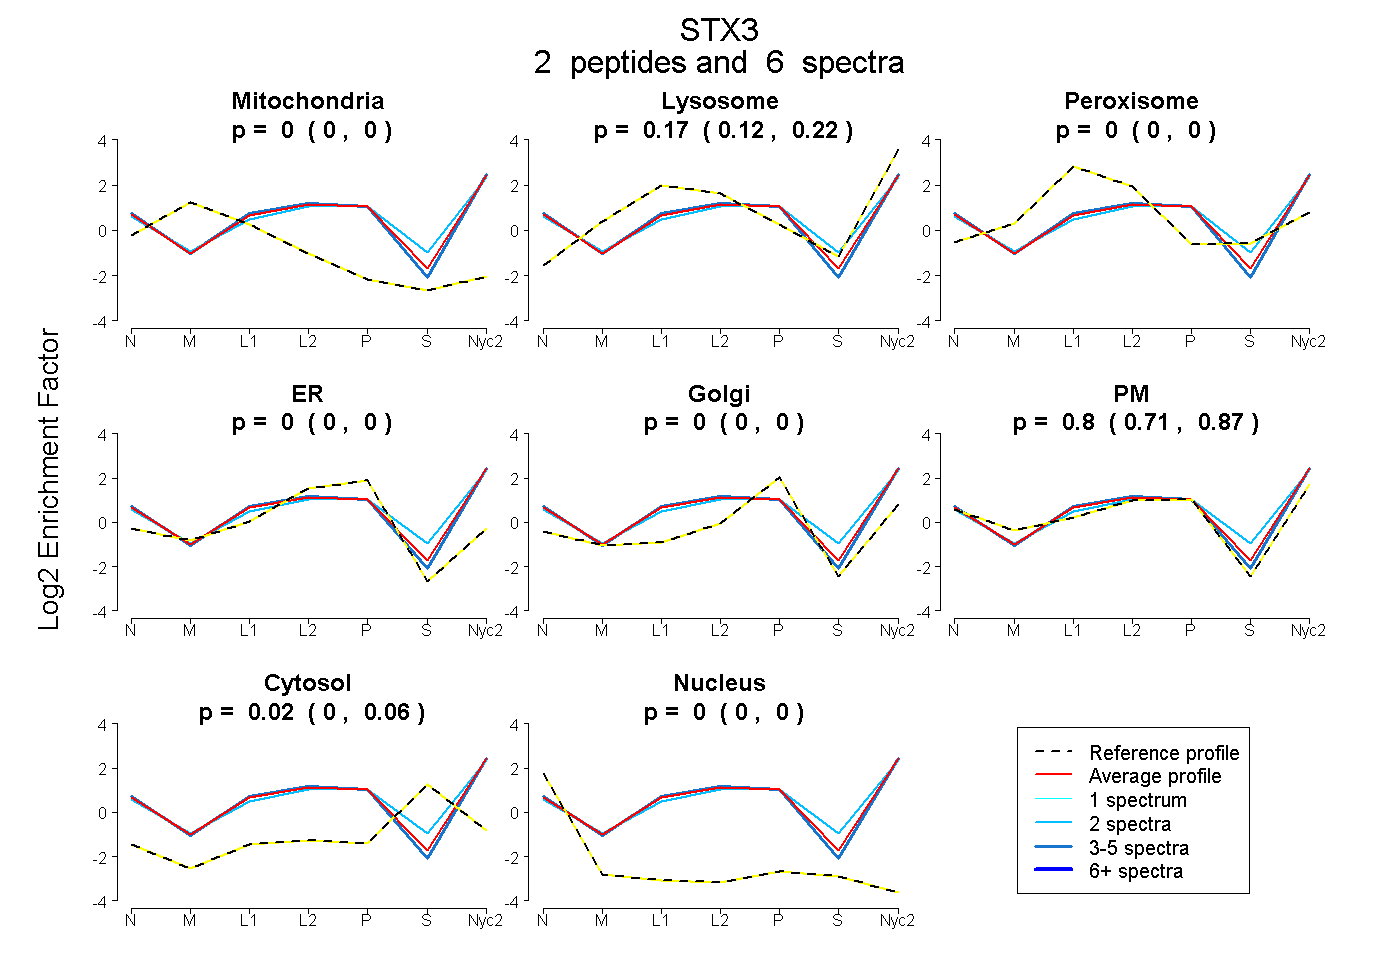
0.000 | 0.000
0.118 | 0.219
0.000 | 0.000
0.000 | 0.000
0.000 | 0.000
0.712 | 0.870
0.000 | 0.063
0.000 | 0.000
1peptide
spectrum
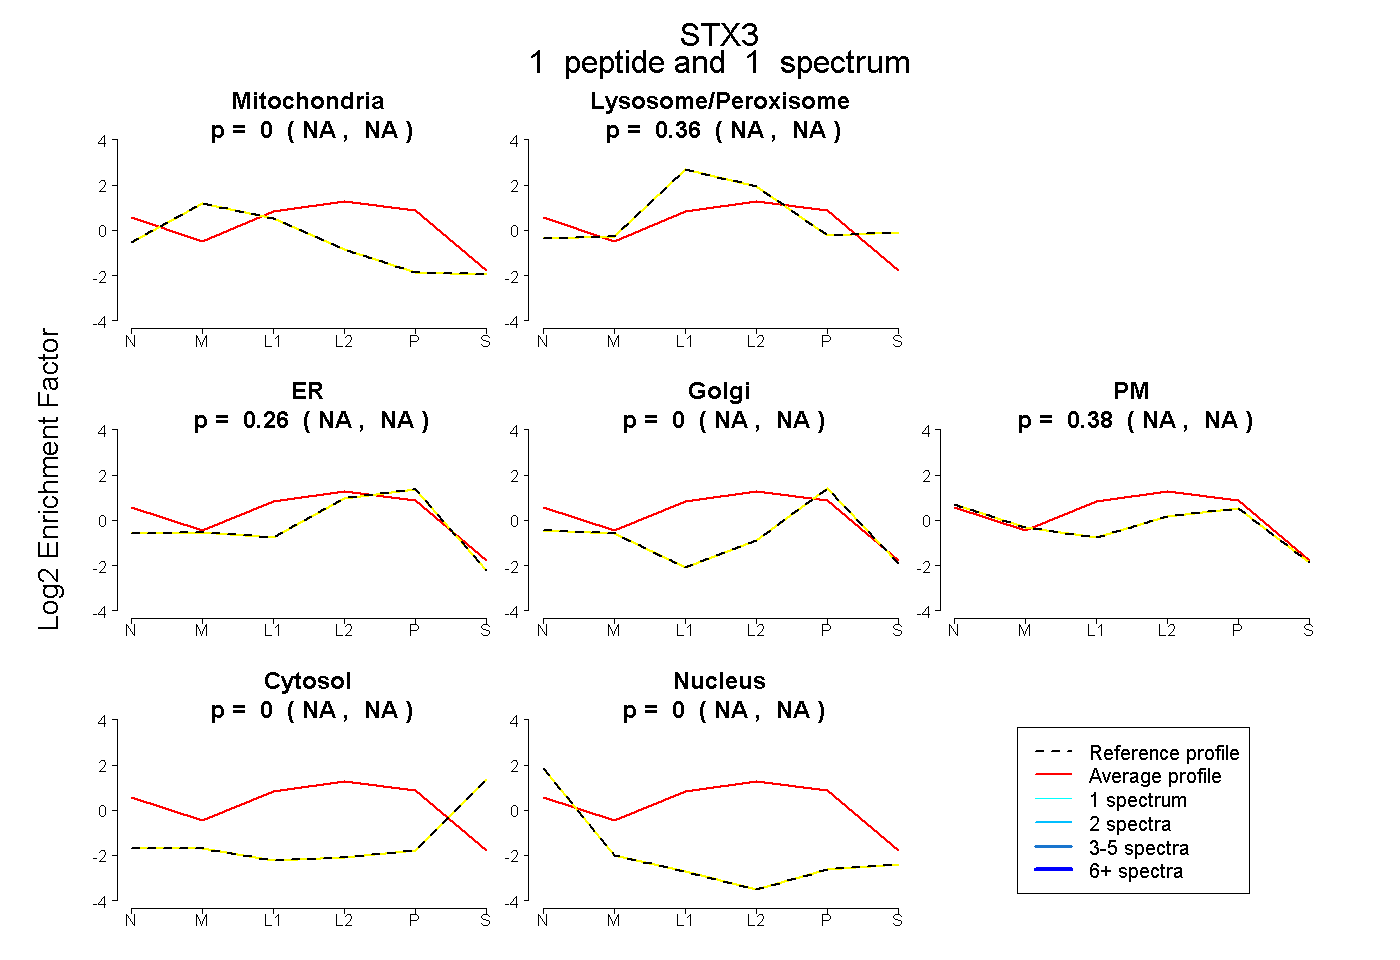
NA | NA
NA | NA
NA | NA
NA | NA
NA | NA
NA | NA
NA | NA
4peptides
spectra
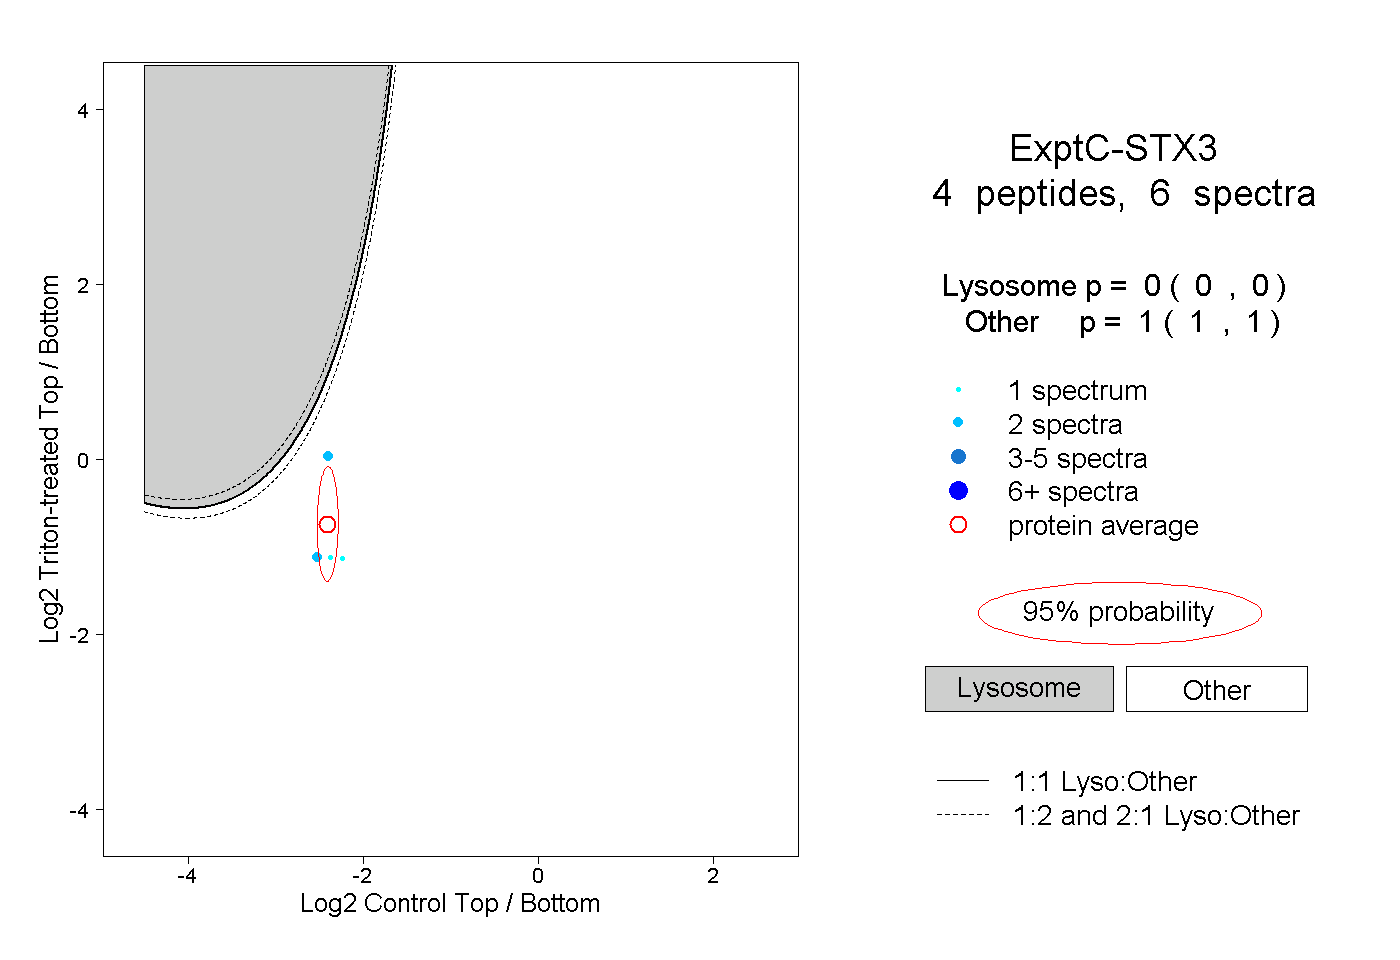
0.000 | 0.000
1.000 | 1.000
2peptides
spectra
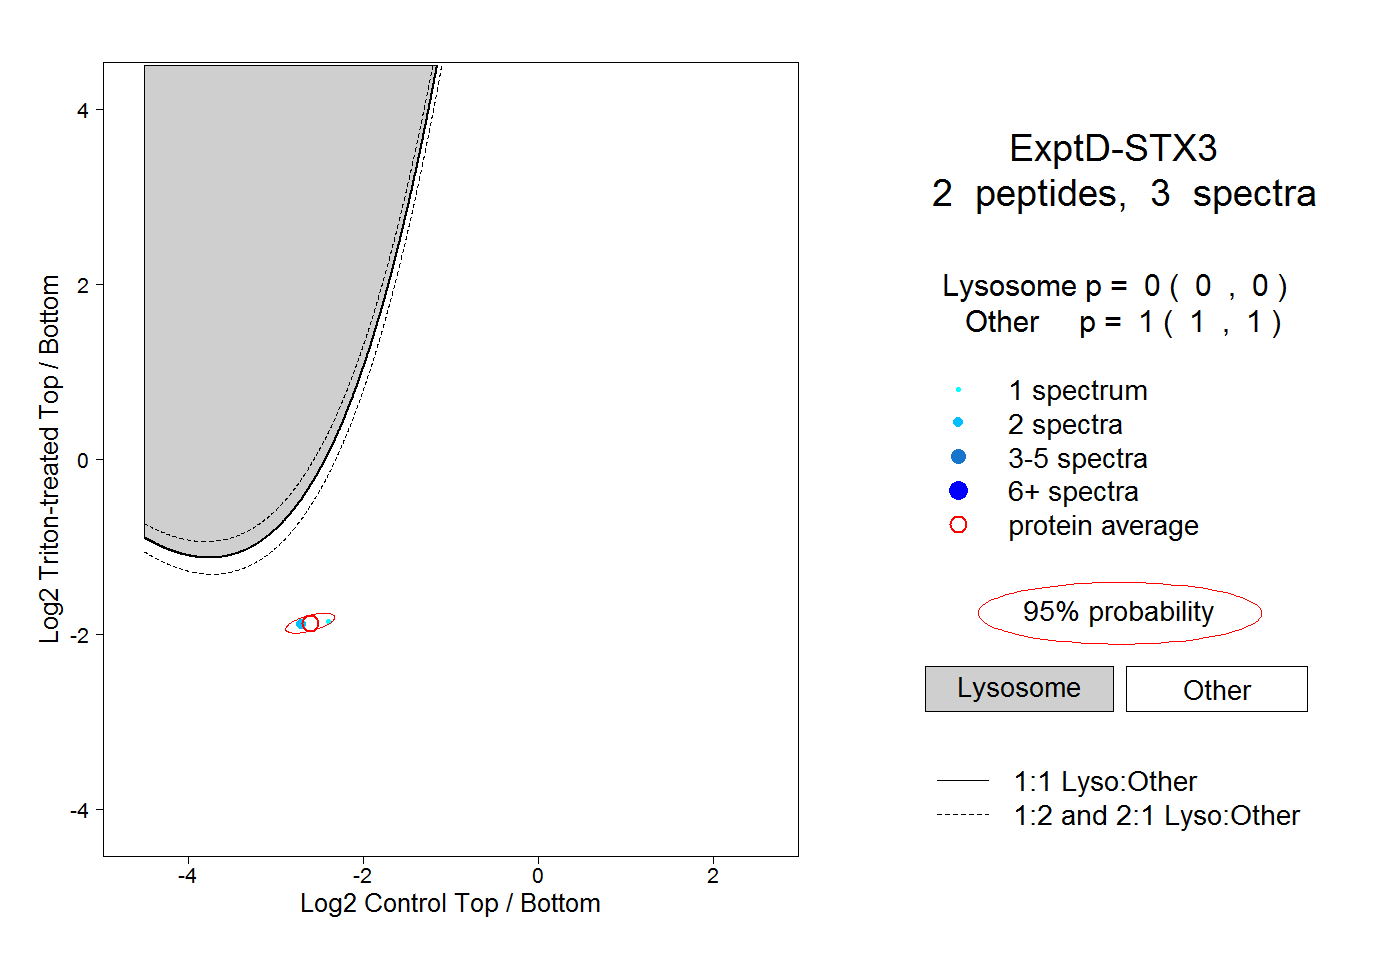
0.000 | 0.000
1.000 | 1.000