 3
3peptides
spectra
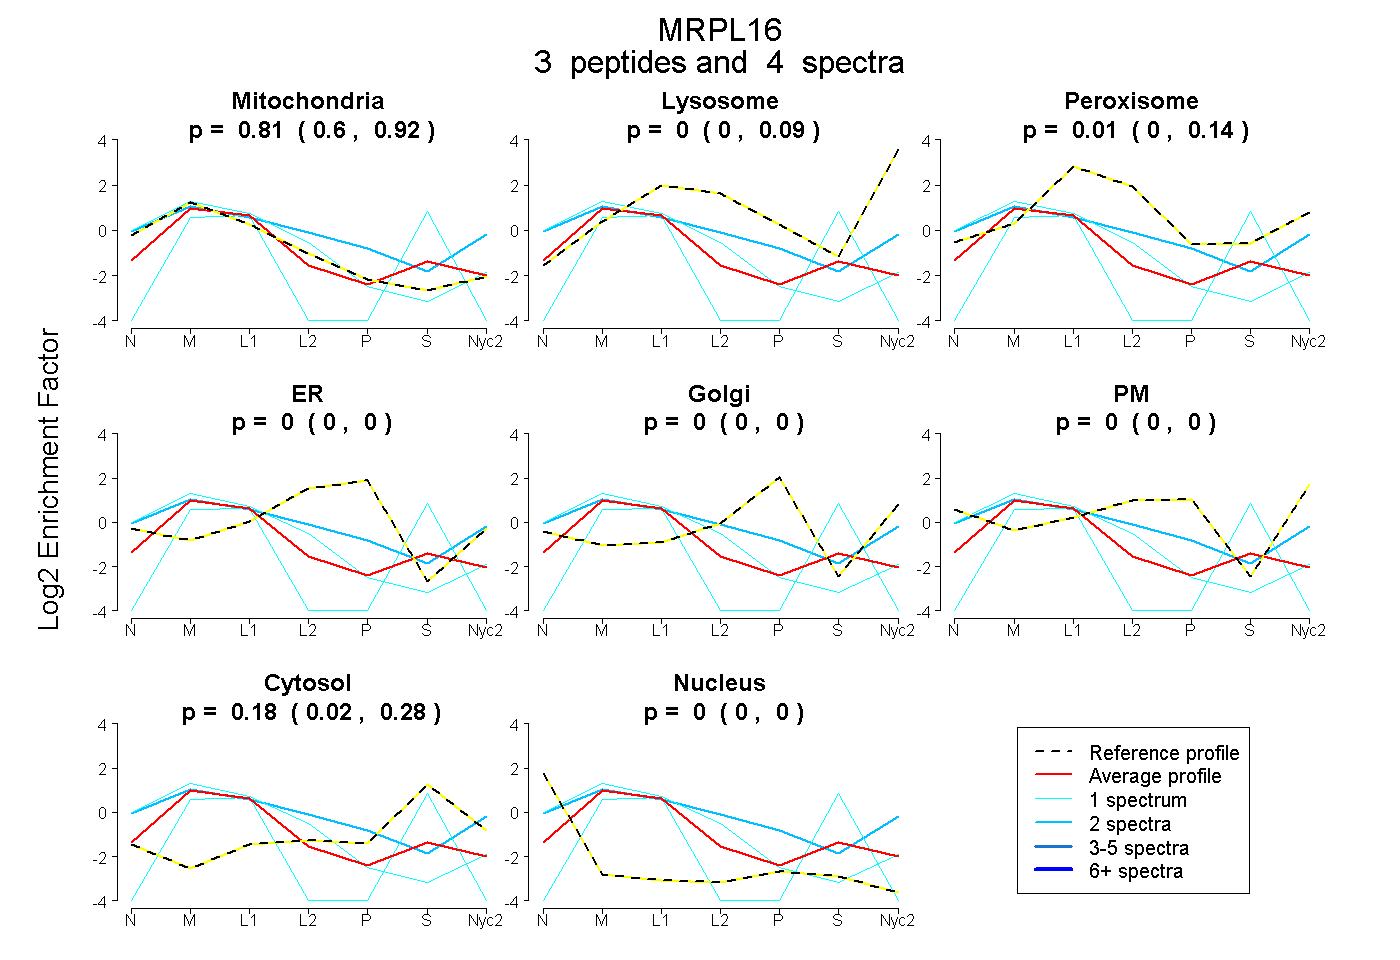
0.604 | 0.921
0.000 | 0.094
0.000 | 0.138
0.000 | 0.000
0.000 | 0.000
0.000 | 0.000
0.024 | 0.285
0.000 | 0.005
1peptide
spectrum
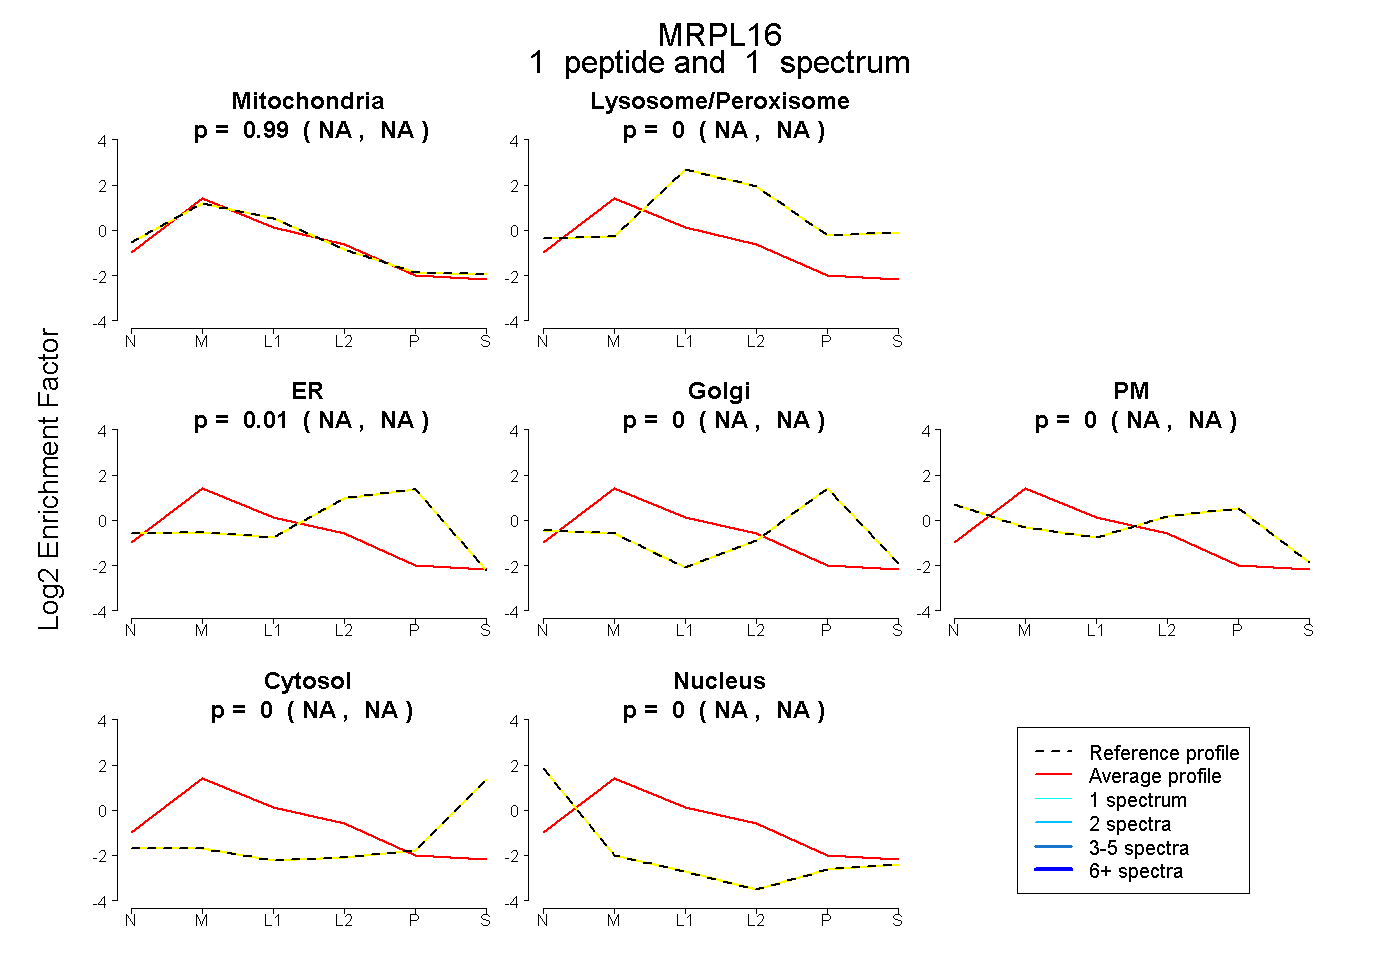
NA | NA
NA | NA
NA | NA
NA | NA
NA | NA
NA | NA
NA | NA
12peptides
spectra
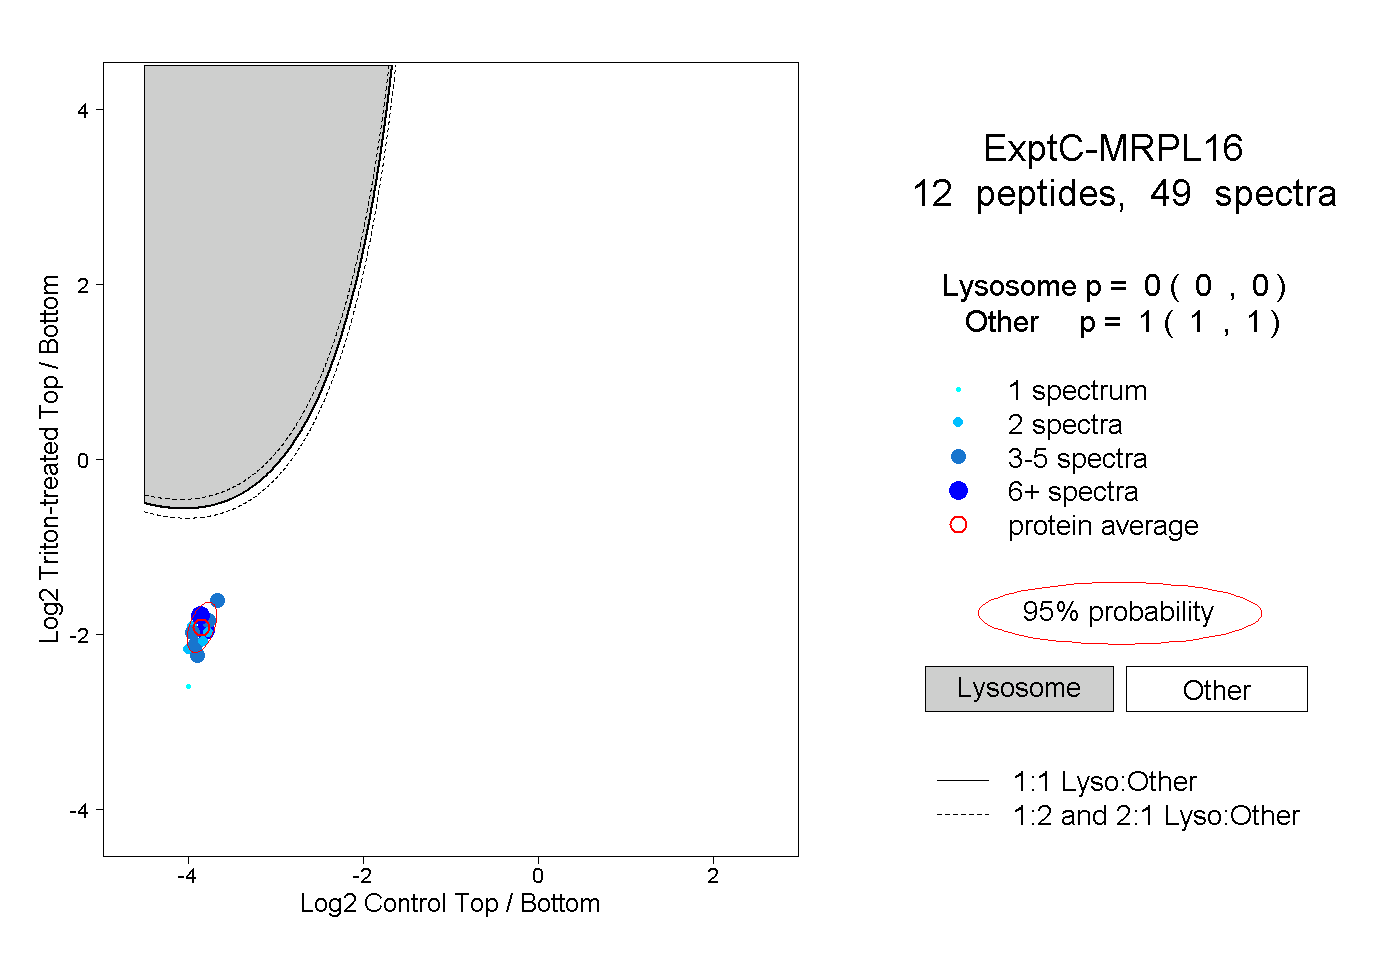
0.000 | 0.000
1.000 | 1.000
1peptide
spectrum
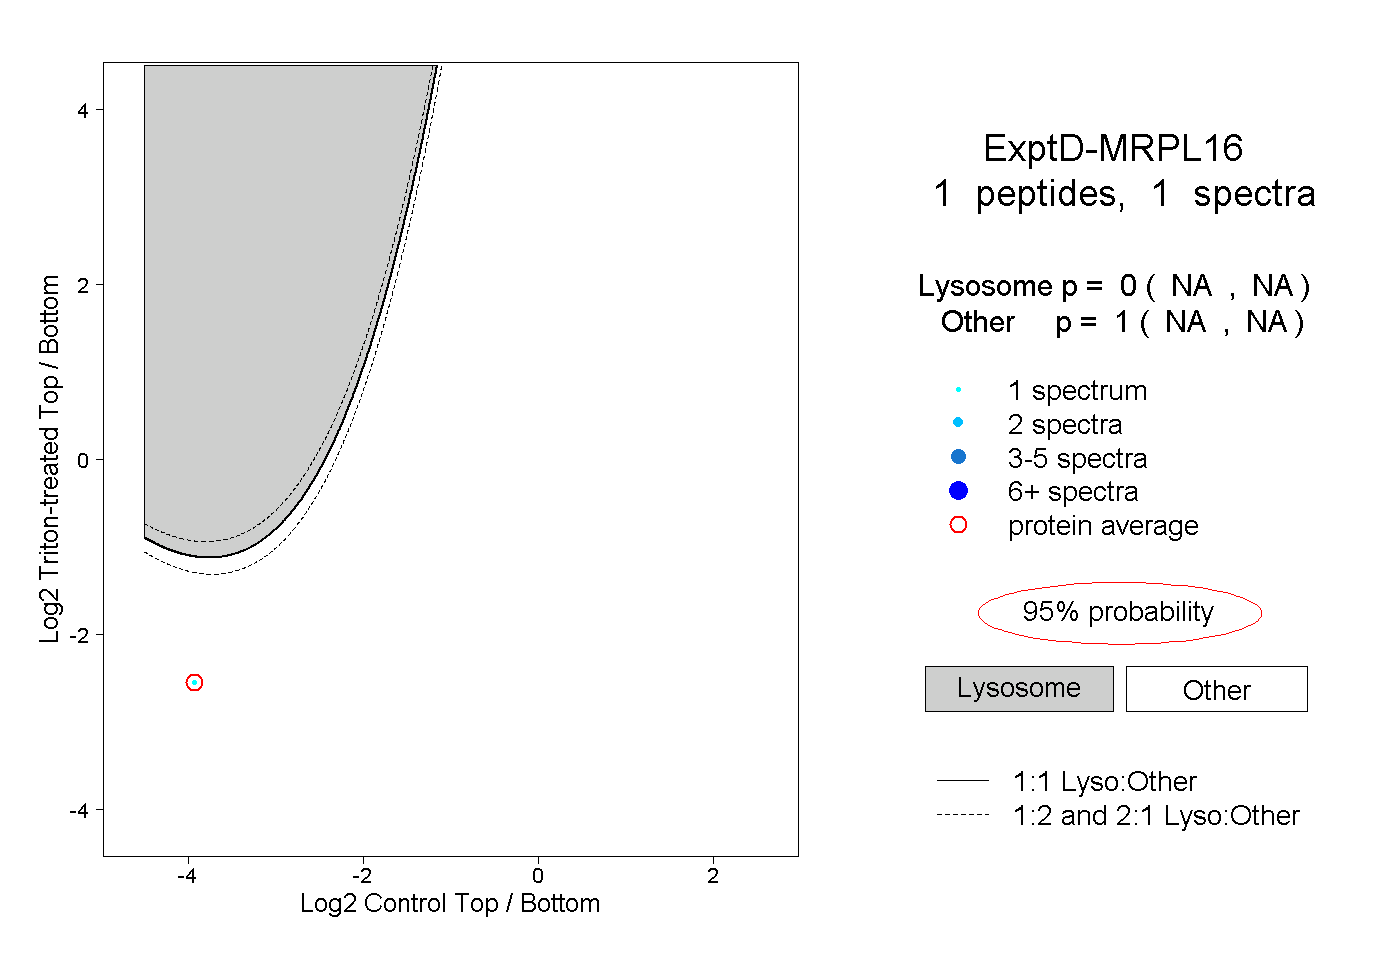
NA | NA
NA | NA