 3
3peptides
spectra
0.000 | 0.040
0.000 | 0.024
0.000 | 0.093
0.844 | 0.991
0.000 | 0.000
0.000 | 0.049
0.000 | 0.000
0.000 | 0.000
| Plot | Mito | Lyso | Perox | ER | Golgi | PM | Cytosol | Nucleus | |||||
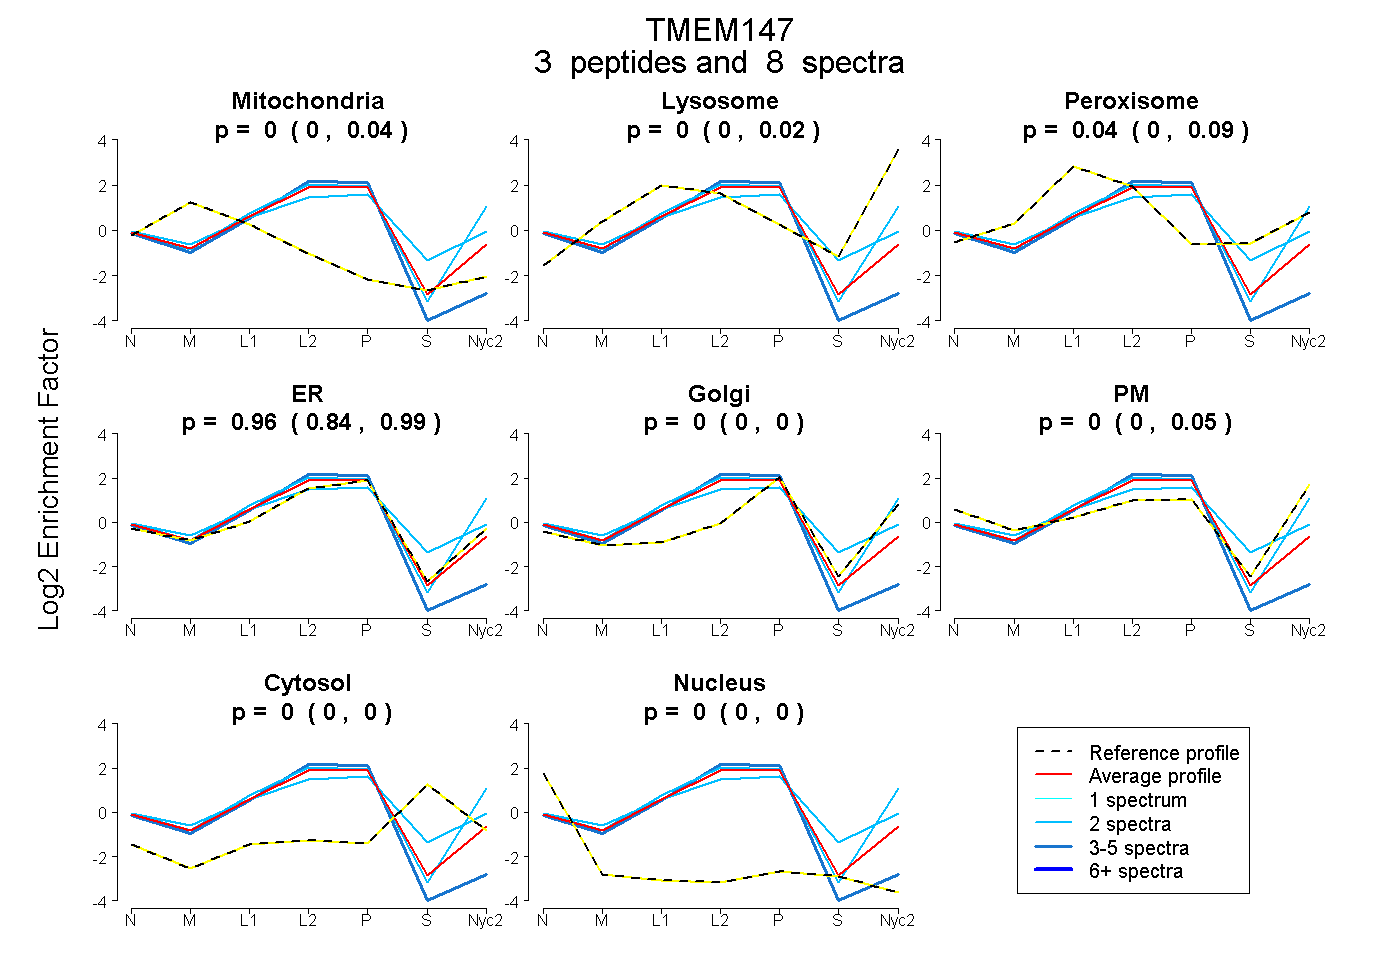
| Expt A |
3 peptides |
8 spectra |
|
0.000 0.000 | 0.040 |
0.000 0.000 | 0.024 |
0.041 0.000 | 0.093 |
0.959 0.844 | 0.991 |
0.000 0.000 | 0.000 |
0.000 0.000 | 0.049 |
0.000 0.000 | 0.000 |
0.000 0.000 | 0.000 |
| 2 spectra, CSGLSEYNAFWK | 0.000 | 0.000 | 0.229 | 0.684 | 0.024 | 0.000 | 0.064 | 0.000 | ||
| 4 spectra, CIPLWVGAR | 0.000 | 0.000 | 0.000 | 0.943 | 0.000 | 0.000 | 0.000 | 0.057 | ||
| 2 spectra, GIEFDWK | 0.000 | 0.116 | 0.000 | 0.629 | 0.000 | 0.255 | 0.000 | 0.000 |
| Plot | Lyso | Other | |||||||||||
| Expt C |
1 peptide |
2 spectra |
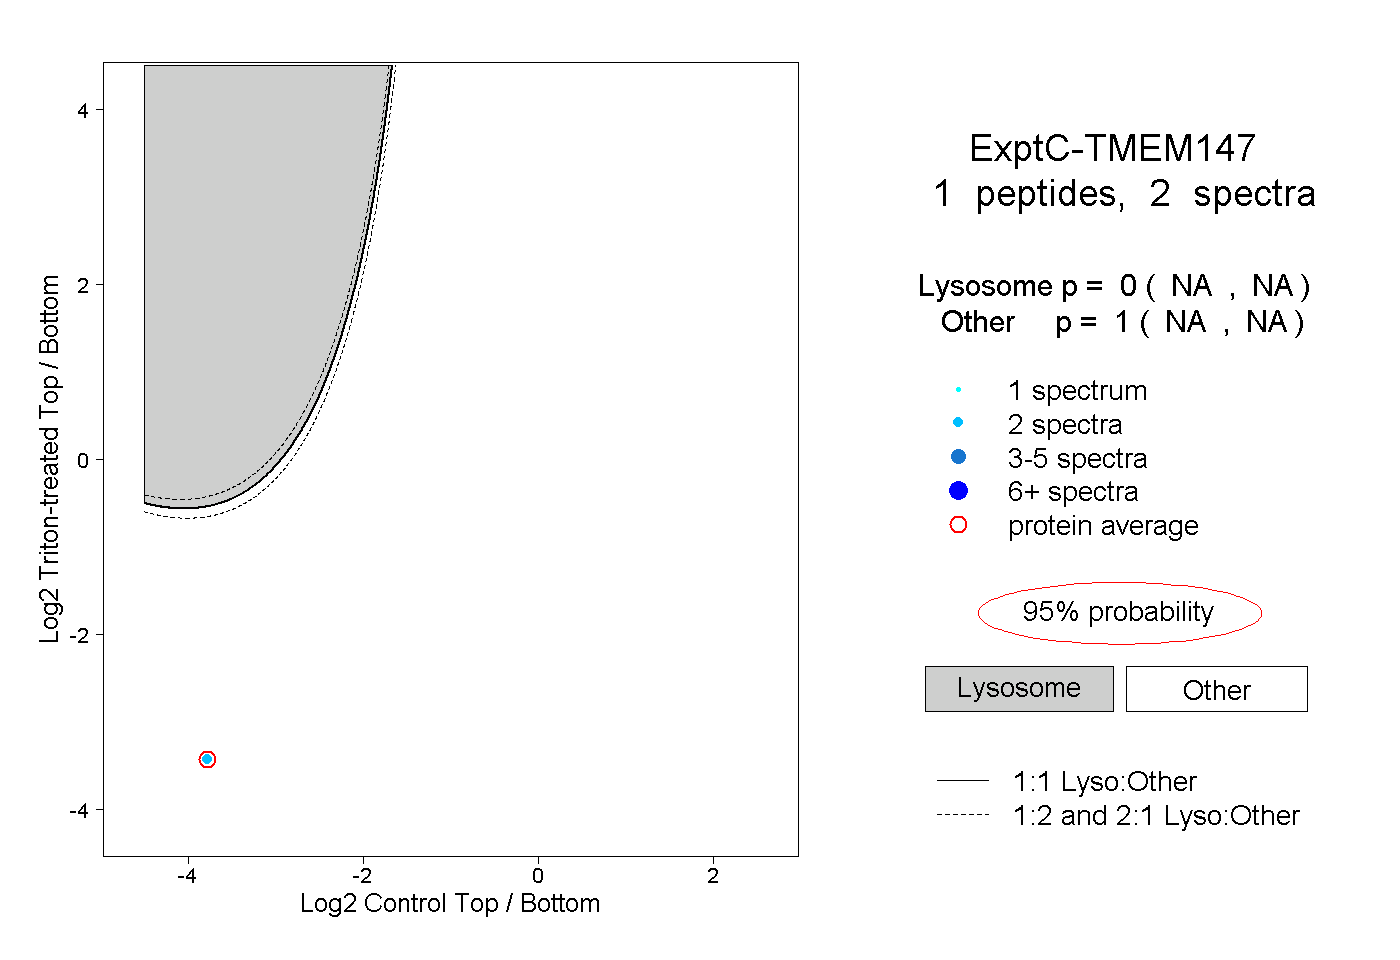 |
0.000 NA | NA |
1.000 NA | NA |
||||||||
| Plot | Lyso | Other | |||||||||||
| Expt D |
1 peptide |
2 spectra |
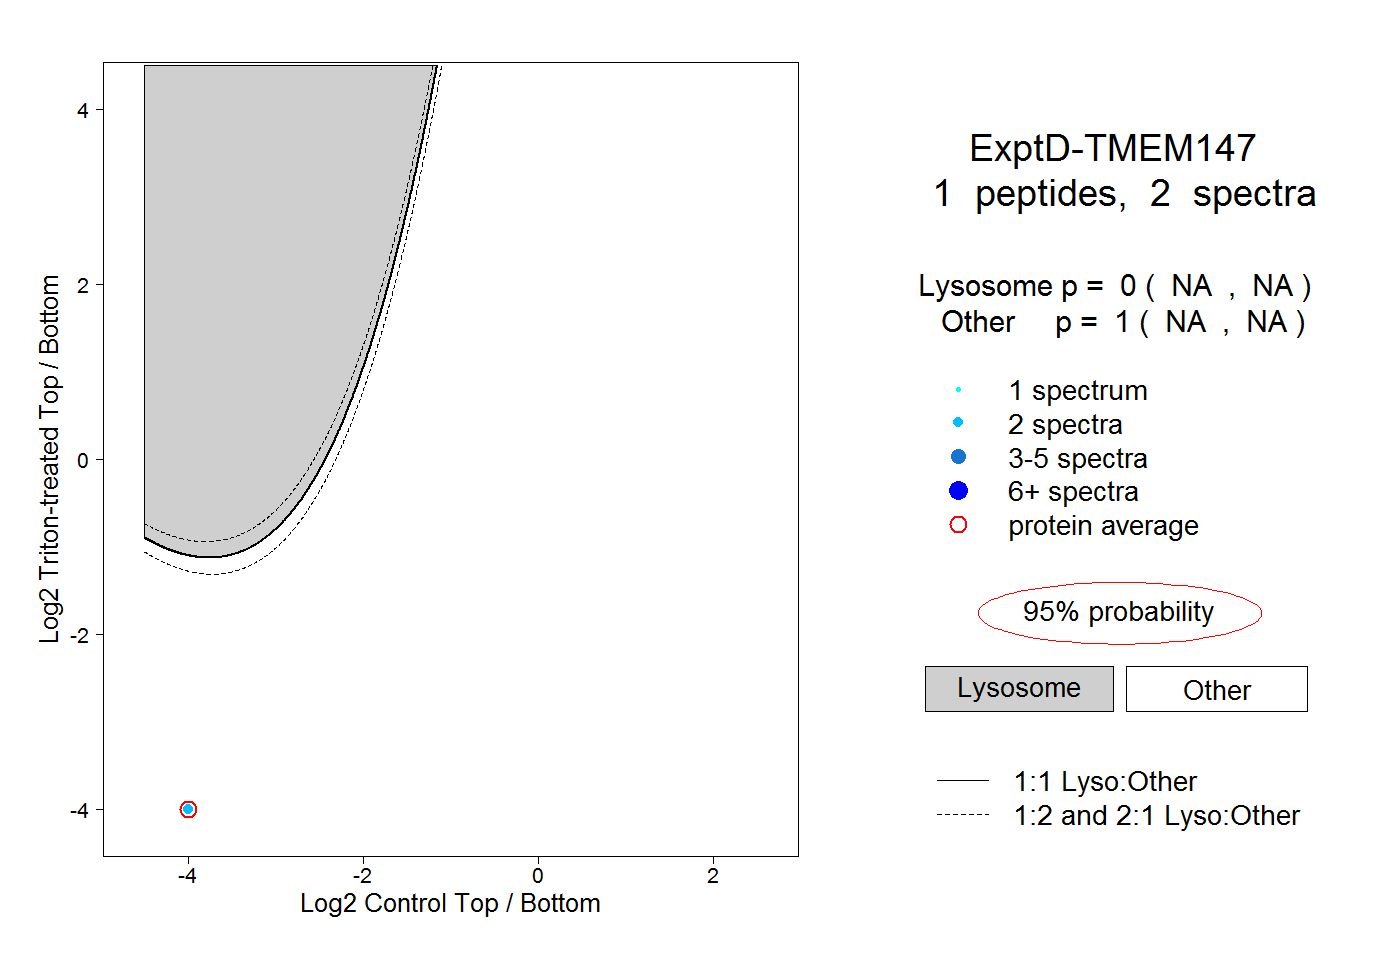 |
0.000 NA | NA |
1.000 NA | NA |