 3
3peptides
spectra
0.000 | 0.212
0.000 | 0.120
0.017 | 0.285
0.000 | 0.000
0.000 | 0.000
0.000 | 0.196
0.547 | 0.695
0.000 | 0.136
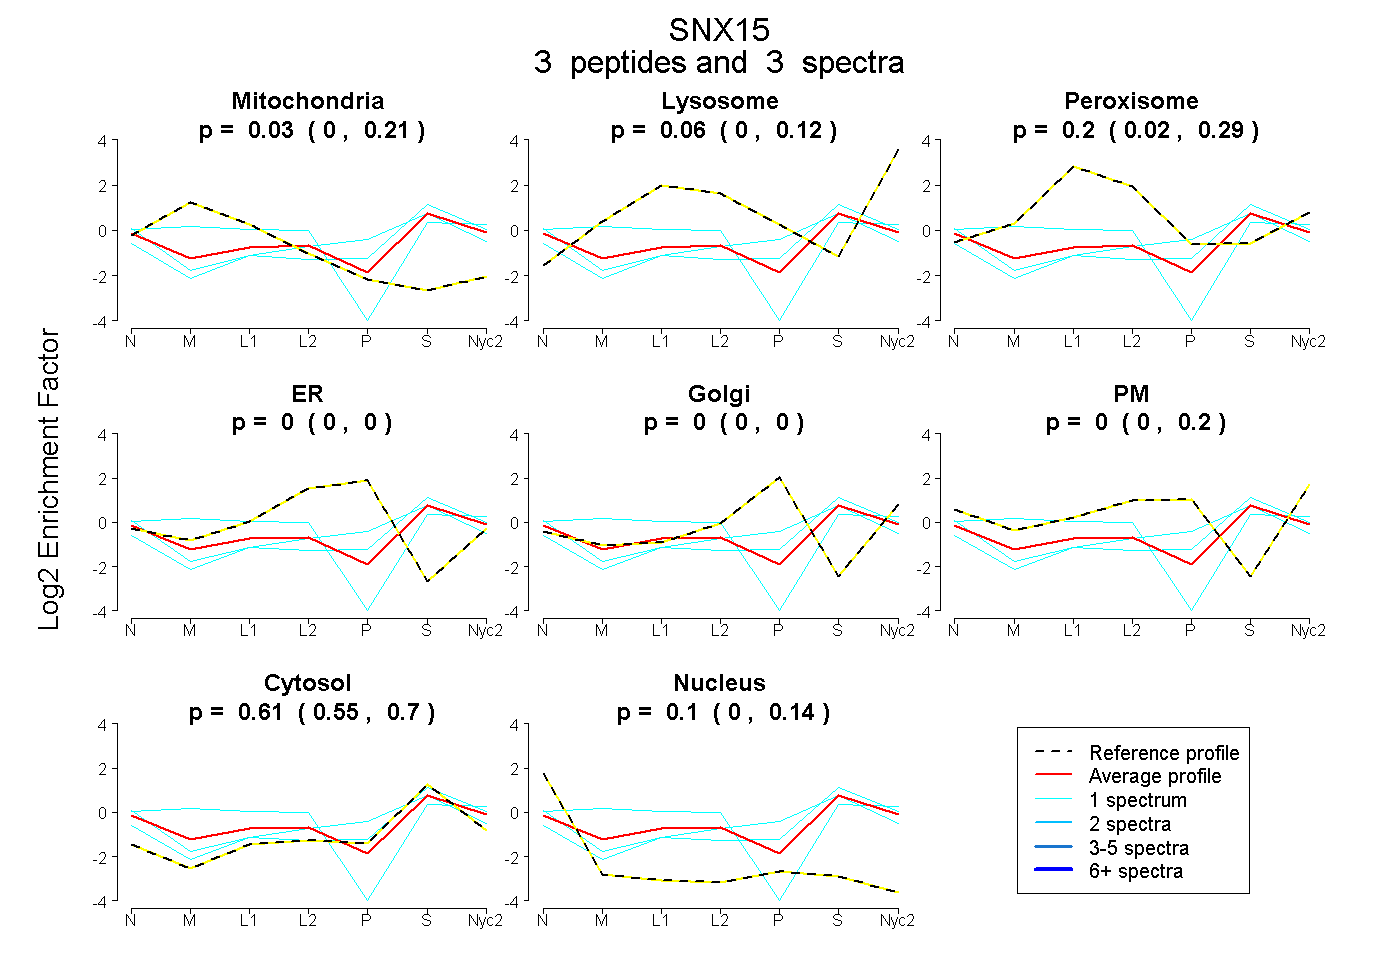
| Plot | Mito | Lyso | Perox | ER | Golgi | PM | Cytosol | Nucleus | |||||
| Expt A |
3 peptides |
3 spectra |
|
0.030 0.000 | 0.212 |
0.060 0.000 | 0.120 |
0.204 0.017 | 0.285 |
0.000 0.000 | 0.000 |
0.000 0.000 | 0.000 |
0.000 0.000 | 0.196 |
0.607 0.547 | 0.695 |
0.099 0.000 | 0.136 |
| 1 spectrum, LLQPLPAER | 0.000 | 0.032 | 0.000 | 0.000 | 0.000 | 0.110 | 0.853 | 0.004 | ||
| 1 spectrum, AETLHAHLP | 0.337 | 0.000 | 0.284 | 0.000 | 0.000 | 0.000 | 0.379 | 0.000 | ||
| 1 spectrum, GGEVTRPSEVSR | 0.000 | 0.000 | 0.000 | 0.000 | 0.000 | 0.268 | 0.688 | 0.044 |
| Plot | Lyso | Other | |||||||||||
| Expt C |
3 peptides |
3 spectra |
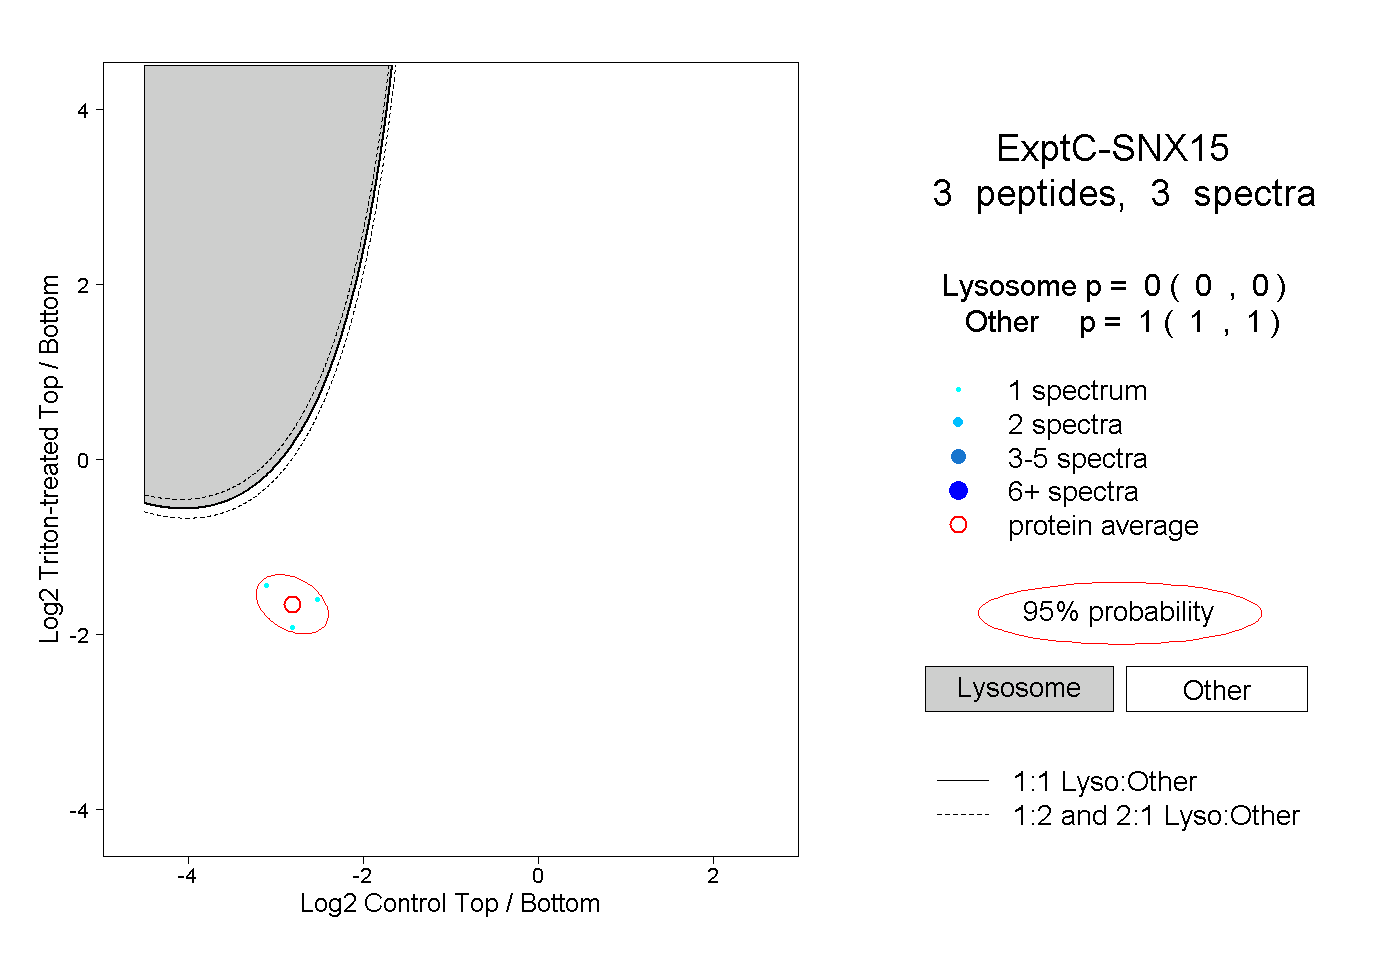 |
0.000 0.000 | 0.000 |
1.000 1.000 | 1.000 |