 20
20peptides
spectra
0.000 | 0.000
0.154 | 0.158
0.000 | 0.000
0.000 | 0.000
0.000 | 0.000
0.000 | 0.000
0.842 | 0.846
0.000 | 0.000
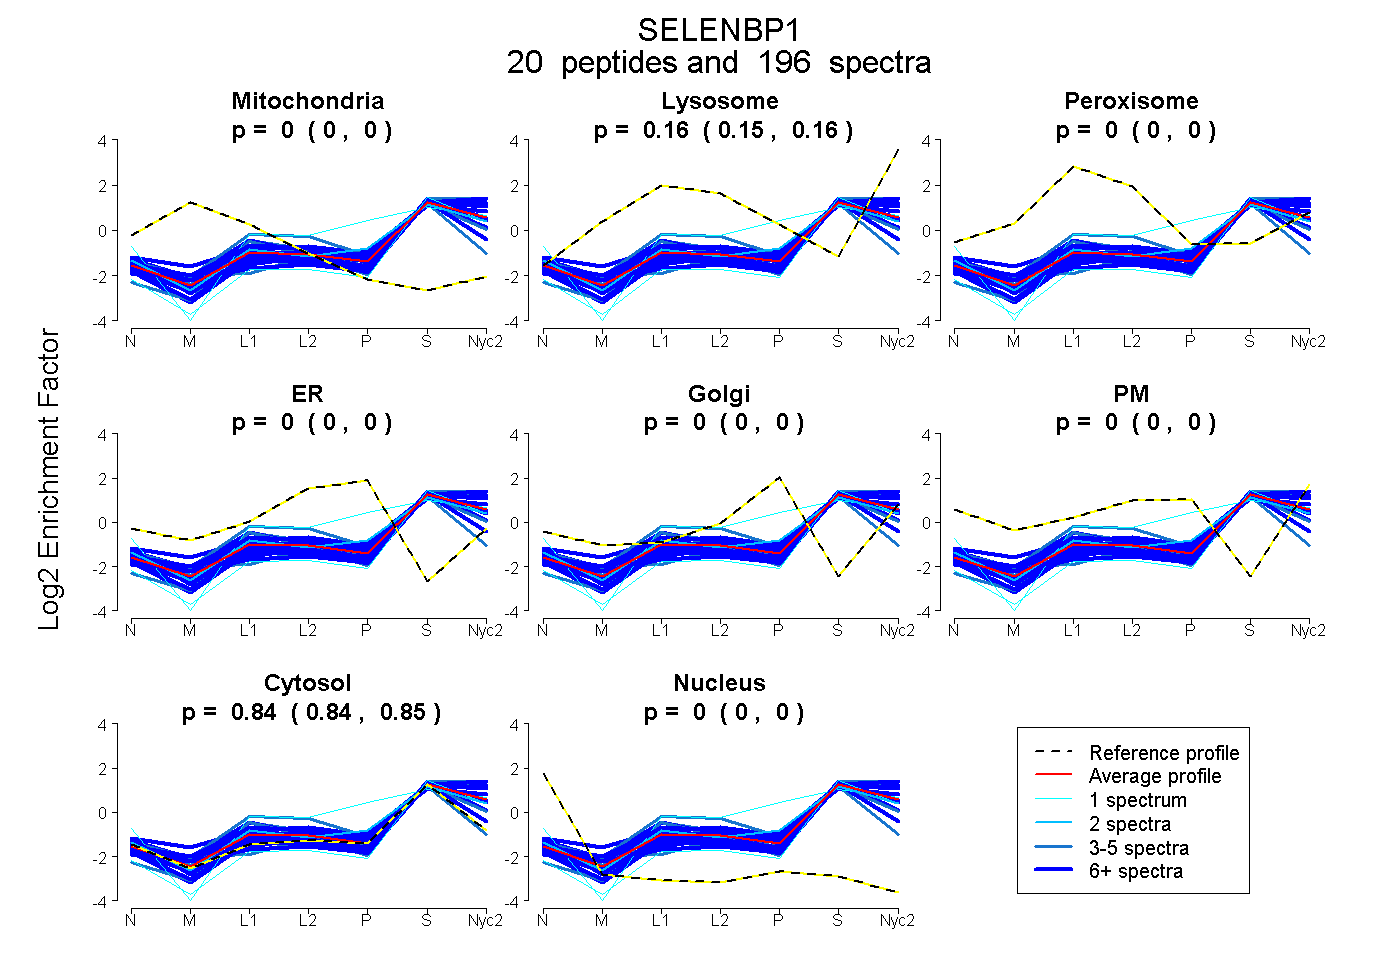
| Plot | Mito | Lyso | Perox | ER | Golgi | PM | Cytosol | Nucleus | |||||
| Expt A |
20 peptides |
196 spectra |
|
0.000 0.000 | 0.000 |
0.156 0.154 | 0.158 |
0.000 0.000 | 0.000 |
0.000 0.000 | 0.000 |
0.000 0.000 | 0.000 |
0.000 0.000 | 0.000 |
0.844 0.842 | 0.846 |
0.000 0.000 | 0.000 |