TM7SF2
[ENSRNOP00000028485]
Main page
| | | Plot |
Mito |
Lyso |
|
Perox |
ER |
Golgi |
PM |
Cytosol |
Nucleus |
|
| Expt A |
 5
5
peptides |
25
spectra |
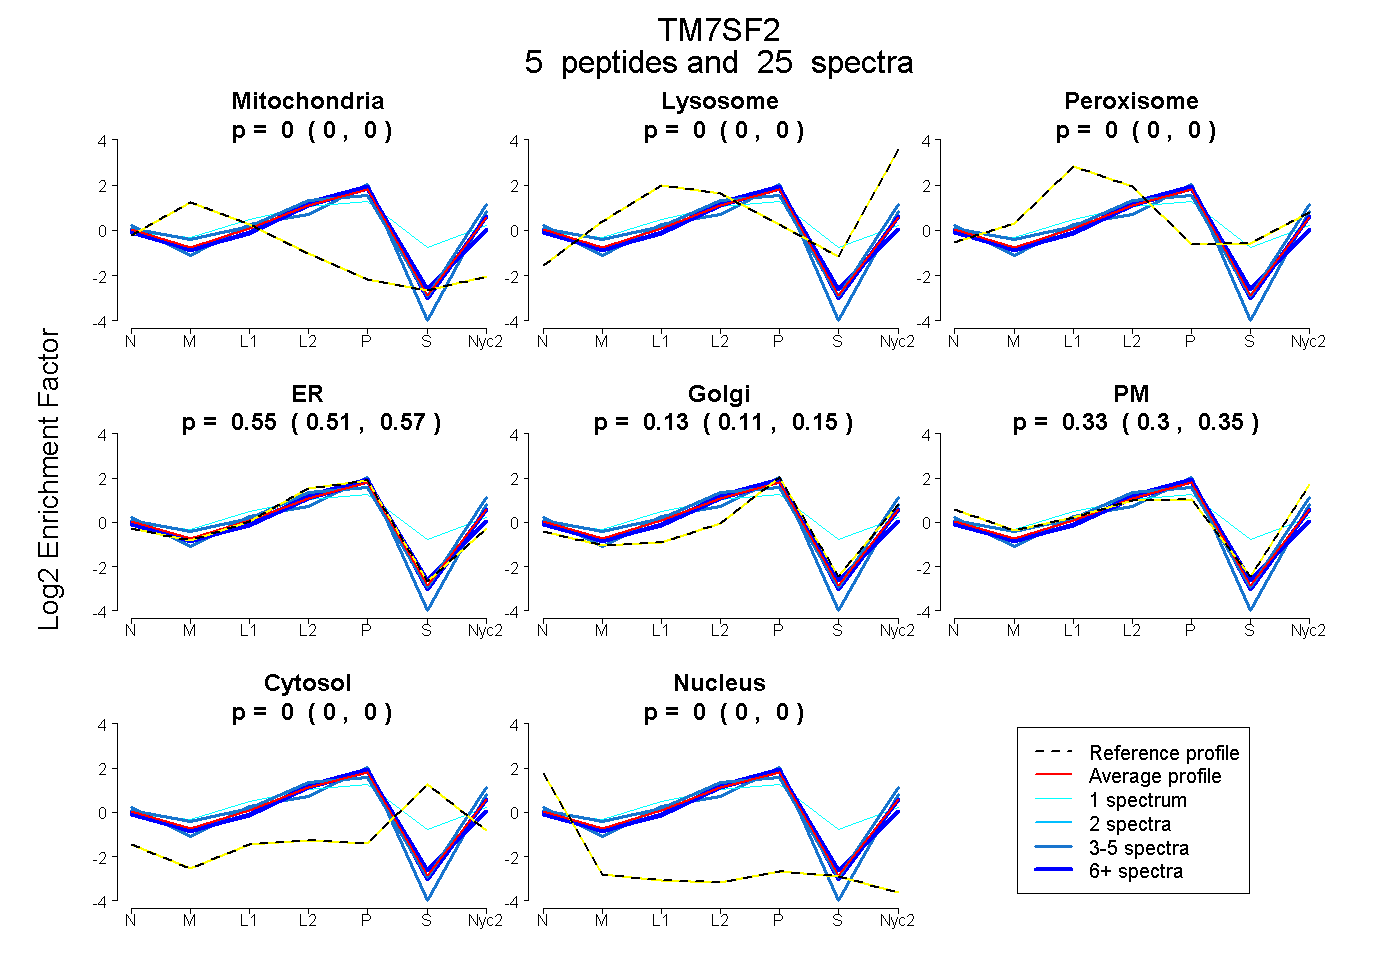 |
0.000
0.000 | 0.000 |
0.000
0.000 | 0.000 |
|
0.000
0.000 | 0.000 |
0.546
0.515 | 0.573 |
0.127
0.106 | 0.145 |
0.326
0.299 | 0.349 |
0.000
0.000 | 0.000 |
0.000
0.000 | 0.000 |
|
| | | Plot |
Mito |
|
Lyso or Perox |
|
ER |
Golgi |
PM |
Cytosol |
Nucleus |
|
| Expt B |
4
peptides |
17
spectra |
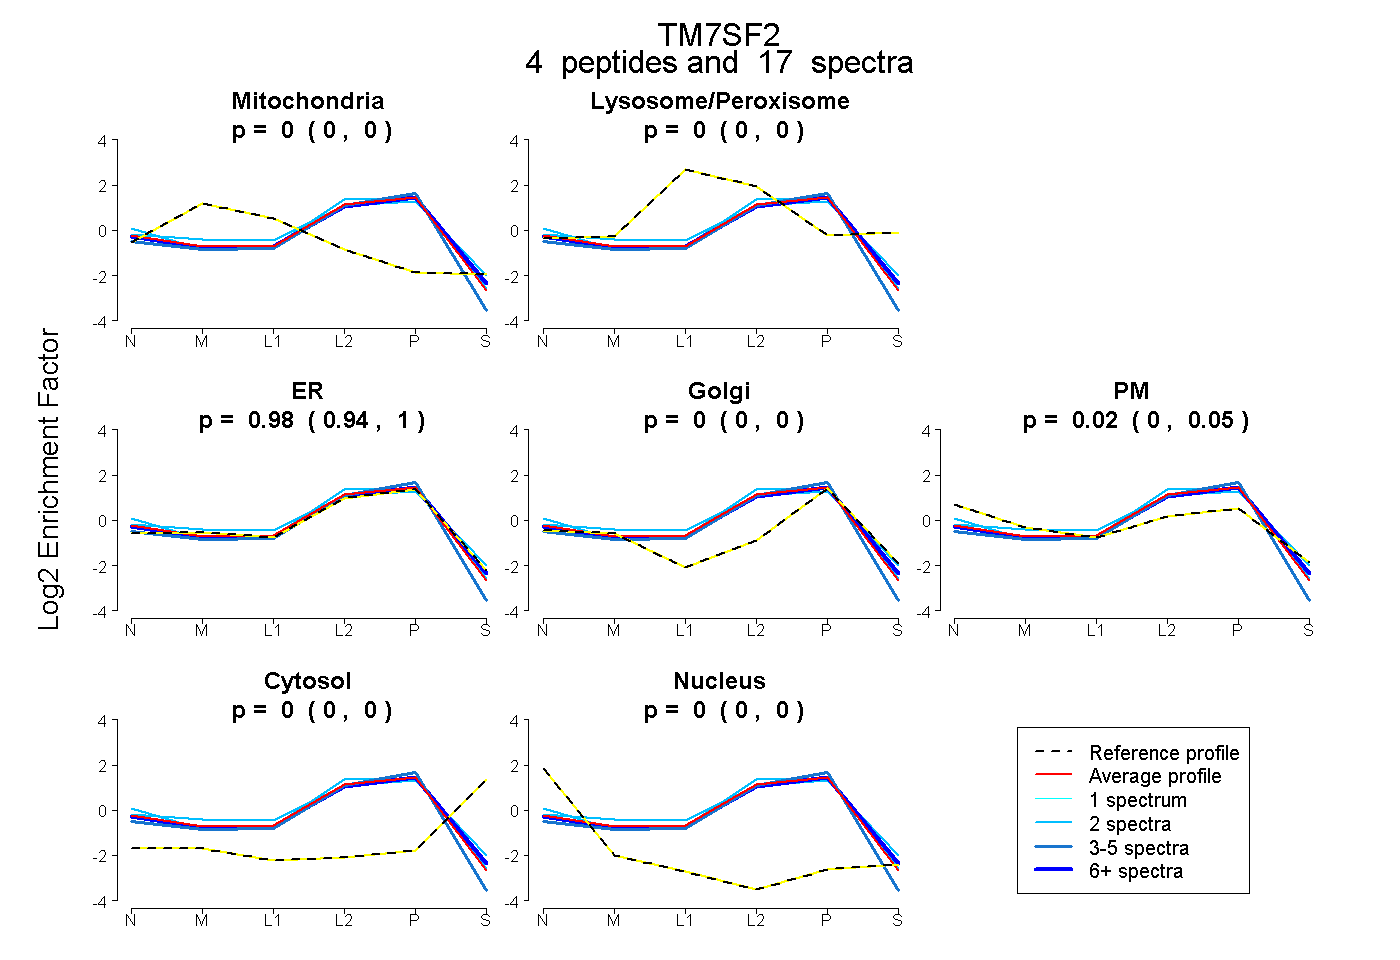 |
0.000
0.000 | 0.000 |
|
0.000
0.000 | 0.000 |
|
0.975
0.945 | 1.000 |
0.000
0.000 | 0.000 |
0.025
0.000 | 0.051 |
0.000
0.000 | 0.000 |
0.000
0.000 | 0.000 |
|
| 2 spectra, DEQQCLR |
0.000 |
|
0.086 |
|
0.770 |
0.000 |
0.145 |
0.000 |
0.000 |
|
| 2 spectra, AVGYYIFR |
0.000 |
|
0.000 |
|
0.902 |
0.000 |
0.098 |
0.000 |
0.000 |
|
| 9 spectra, LGSFDFK |
0.000 |
|
0.000 |
|
0.939 |
0.000 |
0.061 |
0.000 |
0.000 |
|
| 4 spectra, VAEGLELK |
0.000 |
|
0.000 |
|
1.000 |
0.000 |
0.000 |
0.000 |
0.000 |
|
| | | Plot |
|
Lyso |
|
|
|
|
|
|
|
Other |
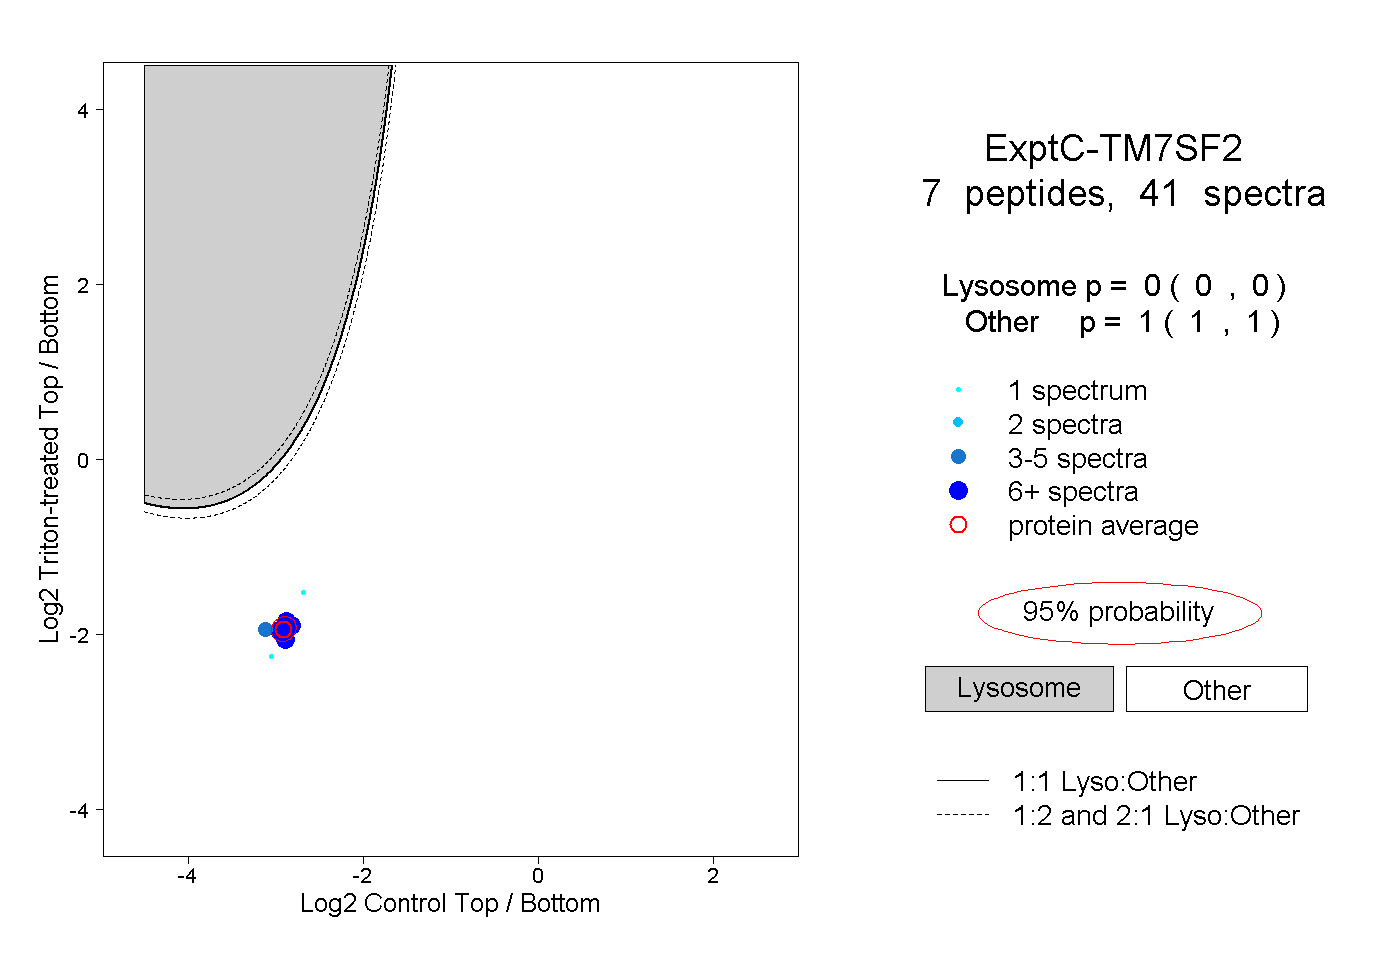
| Expt C |
7
peptides |
41
spectra |
 |
|
0.000
0.000 | 0.000 |
|
|
|
|
|
|
|
1.000
1.000 | 1.000 |
| | | Plot |
|
Lyso |
|
|
|
|
|
|
|
Other |
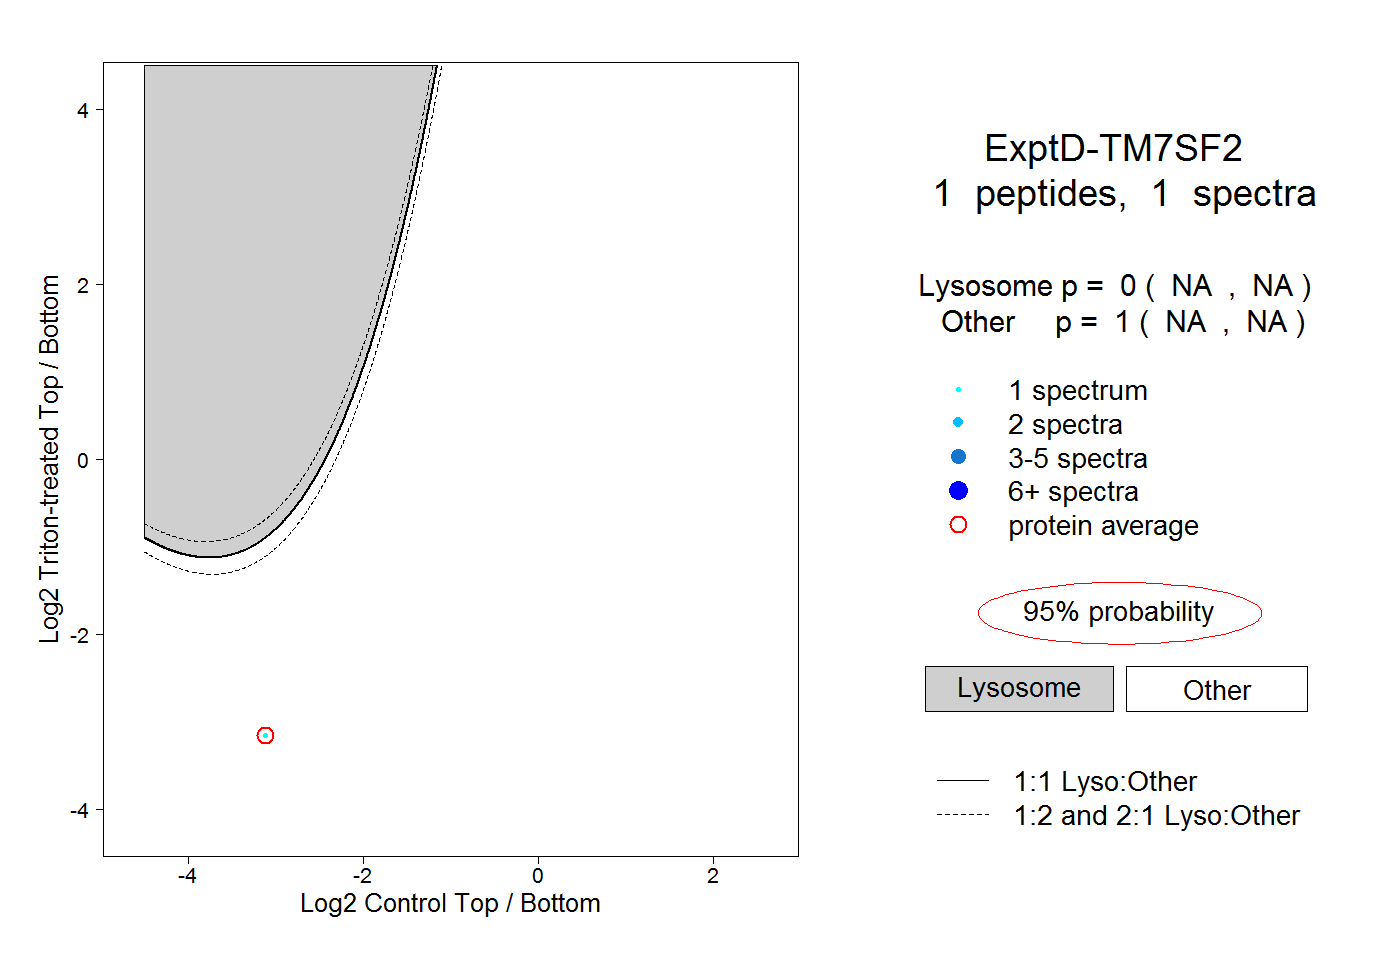
| Expt D |
1
peptide |
1
spectrum |
 |
|
0.000
NA | NA |
|
|
|
|
|
|
|
1.000
NA | NA |