 2
2peptides
spectra

0.000 | 0.000
0.000 | 0.000
0.000 | 0.196
0.000 | 0.523
0.000 | 0.325
0.000 | 0.288
0.238 | 0.475
0.000 | 0.134
1peptide
spectra
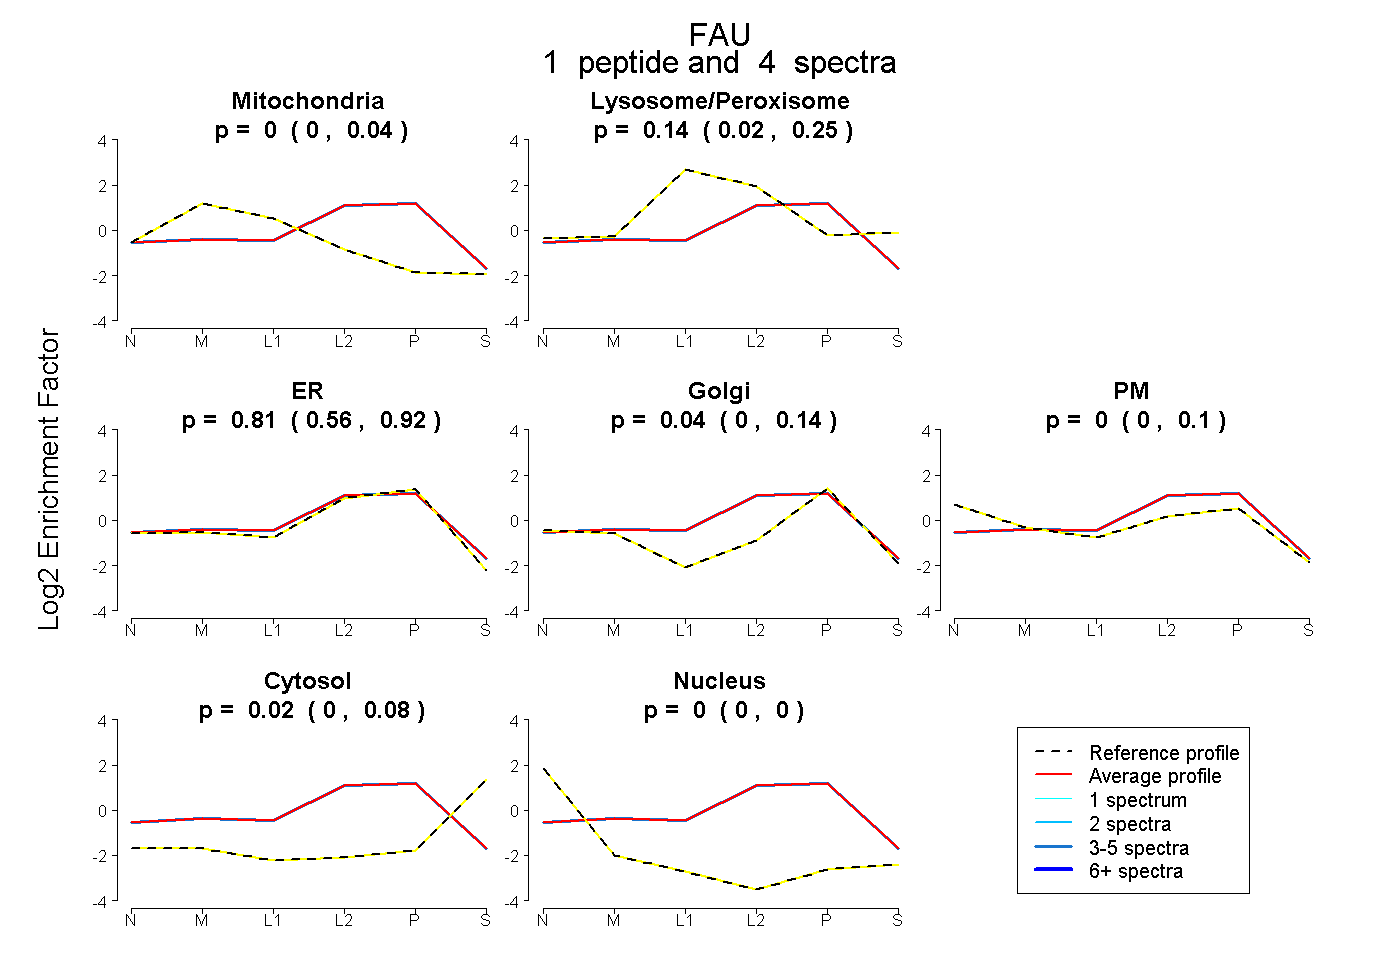
0.000 | 0.043
0.019 | 0.249
0.562 | 0.920
0.000 | 0.136
0.000 | 0.099
0.000 | 0.076
0.000 | 0.000
3peptides
spectra
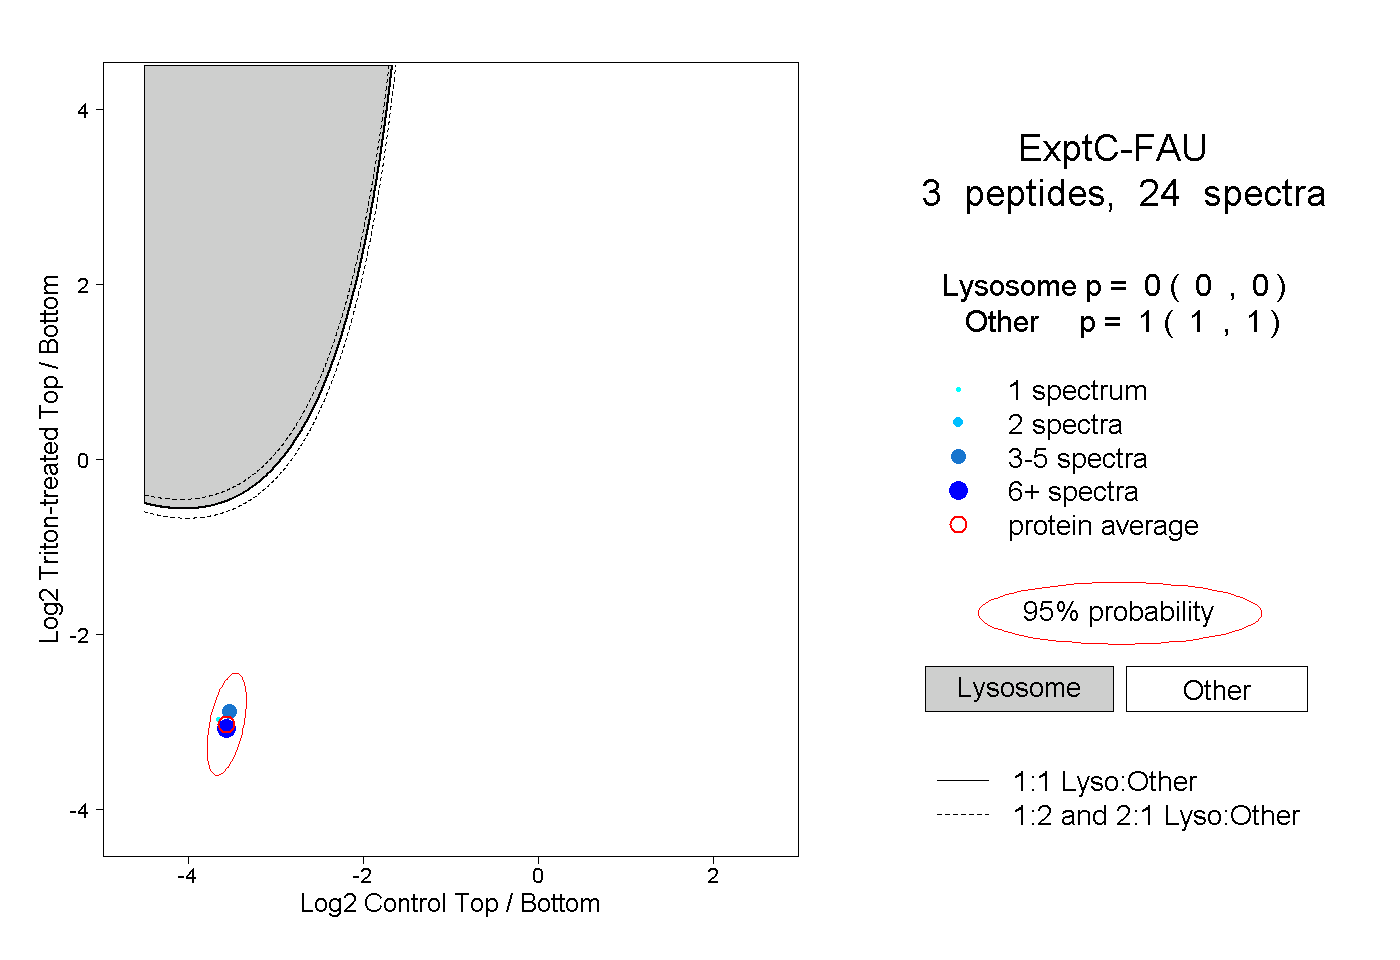
0.000 | 0.000
1.000 | 1.000