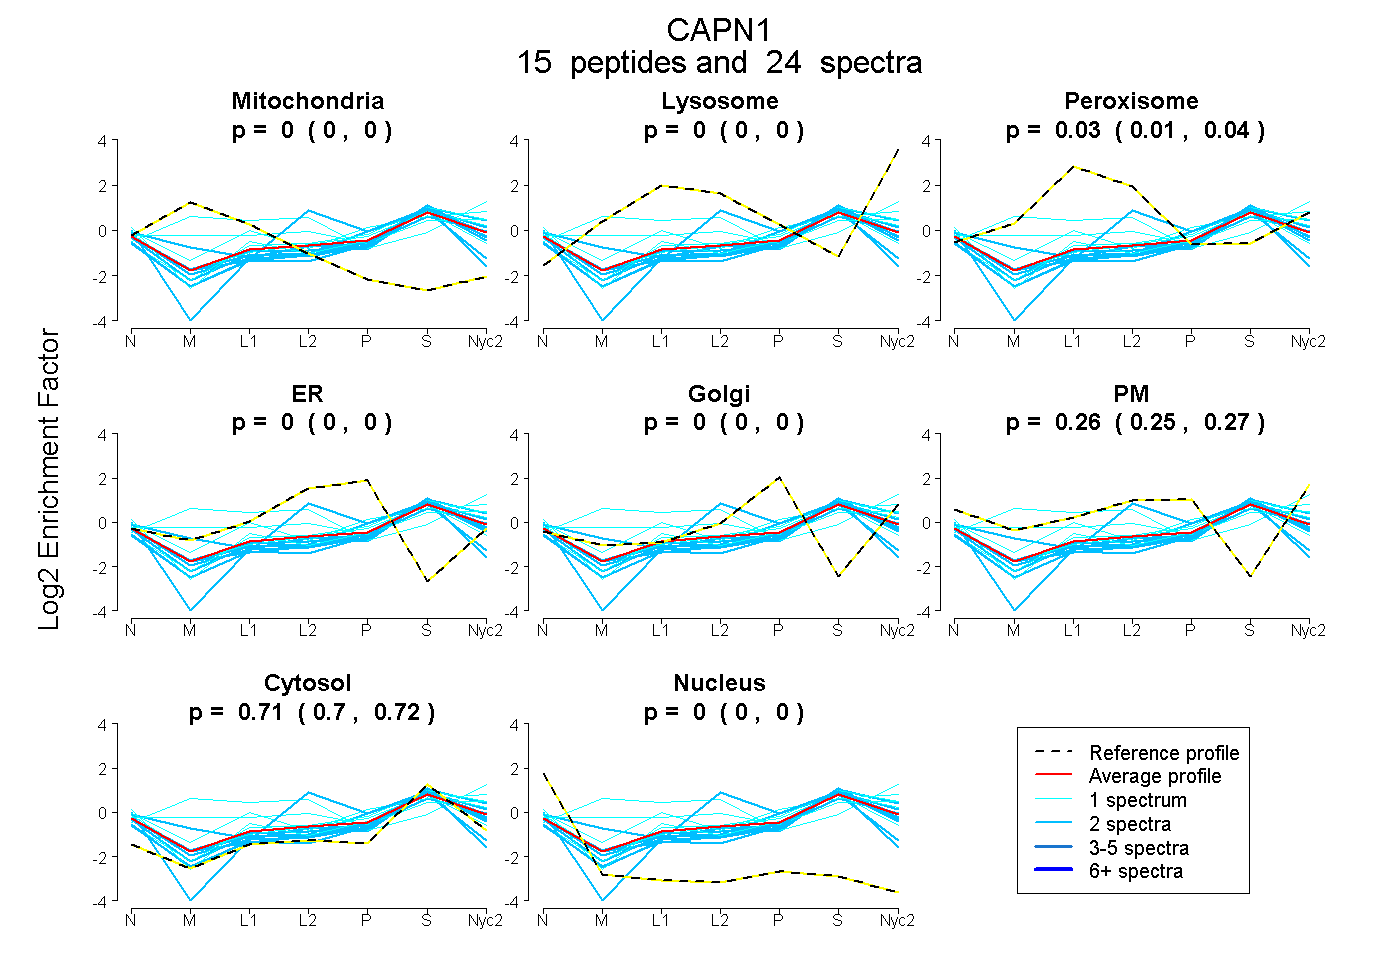
 15
15peptides
spectra
0.000 | 0.000
0.000 | 0.000
0.014 | 0.041
0.000 | 0.000
0.000 | 0.000
0.252 | 0.273
0.698 | 0.717
0.000 | 0.000
| Plot | Mito | Lyso | Perox | ER | Golgi | PM | Cytosol | Nucleus | |||||
| Expt A |
15 peptides |
24 spectra |
|
0.000 0.000 | 0.000 |
0.000 0.000 | 0.000 |
0.028 0.014 | 0.041 |
0.000 0.000 | 0.000 |
0.000 0.000 | 0.000 |
0.264 0.252 | 0.273 |
0.708 0.698 | 0.717 |
0.000 0.000 | 0.000 |
| 2 spectra, ESGCSFLLALMQK | 0.000 | 0.000 | 0.000 | 0.224 | 0.008 | 0.000 | 0.717 | 0.052 | ||
| 1 spectrum, DMETIGFAVYQVPR | 0.183 | 0.405 | 0.145 | 0.000 | 0.000 | 0.028 | 0.239 | 0.000 | ||
| 1 spectrum, HENAIK | 0.000 | 0.118 | 0.031 | 0.000 | 0.000 | 0.302 | 0.549 | 0.000 | ||
| 2 spectra, VDPYER | 0.000 | 0.000 | 0.022 | 0.305 | 0.000 | 0.000 | 0.673 | 0.000 | ||
| 2 spectra, DFFLANASR | 0.000 | 0.000 | 0.000 | 0.000 | 0.017 | 0.217 | 0.764 | 0.003 | ||
| 1 spectrum, LVFVHSAQGNEFWSALLEK | 0.000 | 0.000 | 0.000 | 0.000 | 0.000 | 0.311 | 0.689 | 0.000 | ||
| 1 spectrum, VLSEEEIDDNFK | 0.000 | 0.000 | 0.051 | 0.000 | 0.000 | 0.178 | 0.711 | 0.059 | ||
| 2 spectra, QVTYQGQR | 0.000 | 0.000 | 0.000 | 0.000 | 0.079 | 0.065 | 0.851 | 0.005 | ||
| 2 spectra, ELAGQPVHLK | 0.000 | 0.000 | 0.039 | 0.000 | 0.000 | 0.204 | 0.752 | 0.005 | ||
| 2 spectra, ELQTILNR | 0.000 | 0.000 | 0.000 | 0.000 | 0.000 | 0.239 | 0.761 | 0.000 | ||
| 2 spectra, FFSEK | 0.078 | 0.000 | 0.000 | 0.000 | 0.000 | 0.299 | 0.623 | 0.000 | ||
| 2 spectra, APSDLYQIILK | 0.000 | 0.000 | 0.000 | 0.000 | 0.000 | 0.158 | 0.842 | 0.000 | ||
| 2 spectra, GSLLGCSINISDIR | 0.000 | 0.000 | 0.045 | 0.090 | 0.000 | 0.000 | 0.755 | 0.110 | ||
| 1 spectrum, LEICNLTPDALK | 0.066 | 0.090 | 0.195 | 0.000 | 0.000 | 0.195 | 0.453 | 0.000 | ||
| 1 spectrum, SMVNLMDR | 0.000 | 0.099 | 0.000 | 0.000 | 0.000 | 0.194 | 0.708 | 0.000 |
| Plot | Mito | Lyso or Perox | ER | Golgi | PM | Cytosol | Nucleus | ||||||
| Expt B |
5 peptides |
8 spectra |
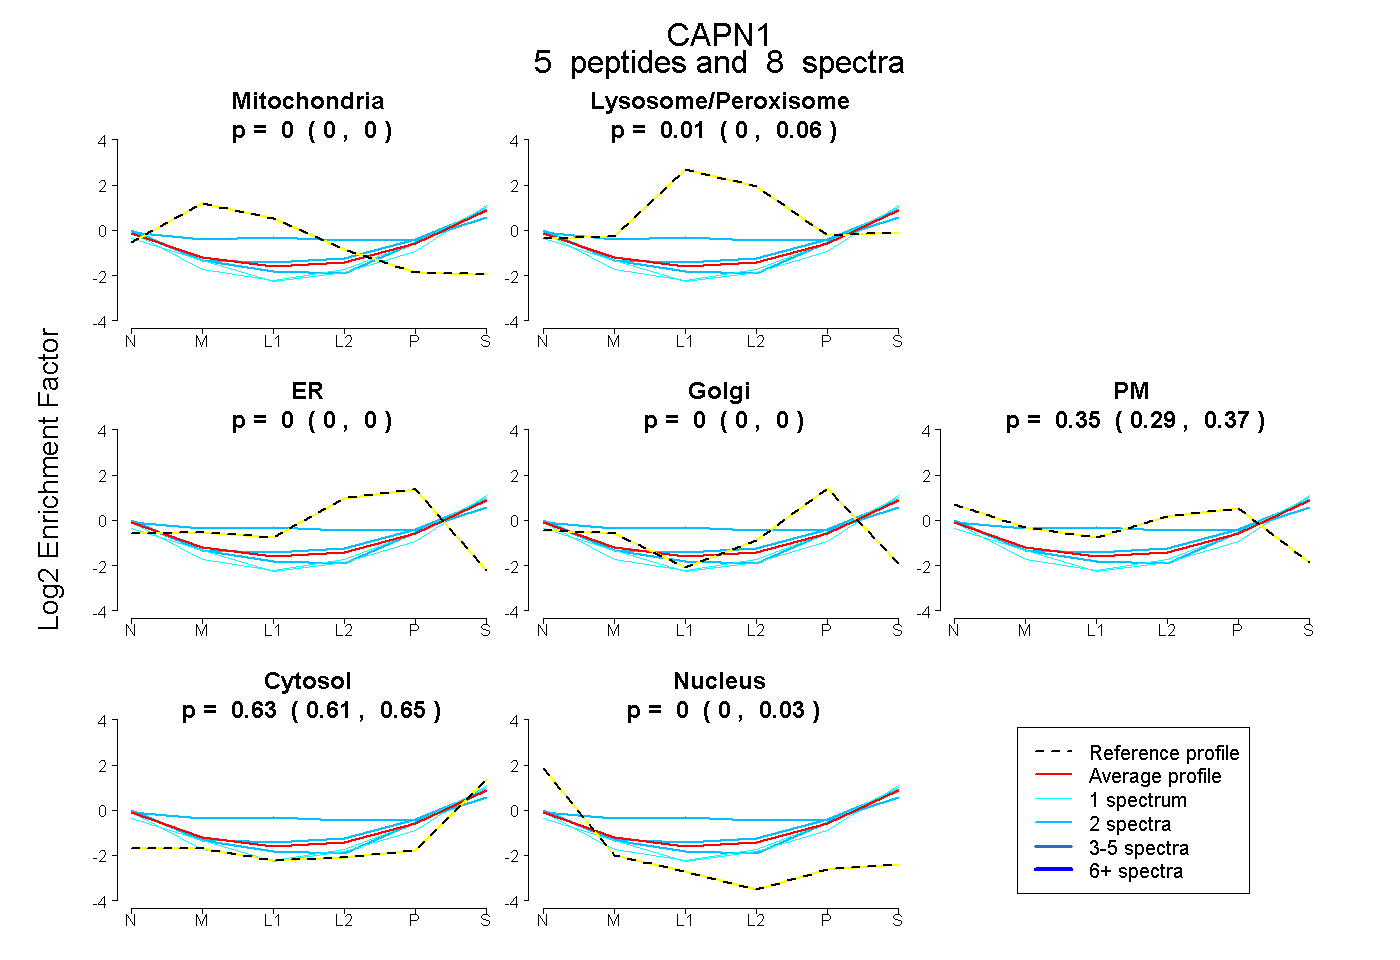 |
0.000 0.000 | 0.000 |
0.015 0.000 | 0.064 |
0.000 0.000 | 0.000 |
0.000 0.000 | 0.000 |
0.352 0.291 | 0.367 |
0.634 0.607 | 0.648 |
0.000 0.000 | 0.026 |
|||
| Plot | Lyso | Other | |||||||||||
| Expt C |
13 peptides |
31 spectra |
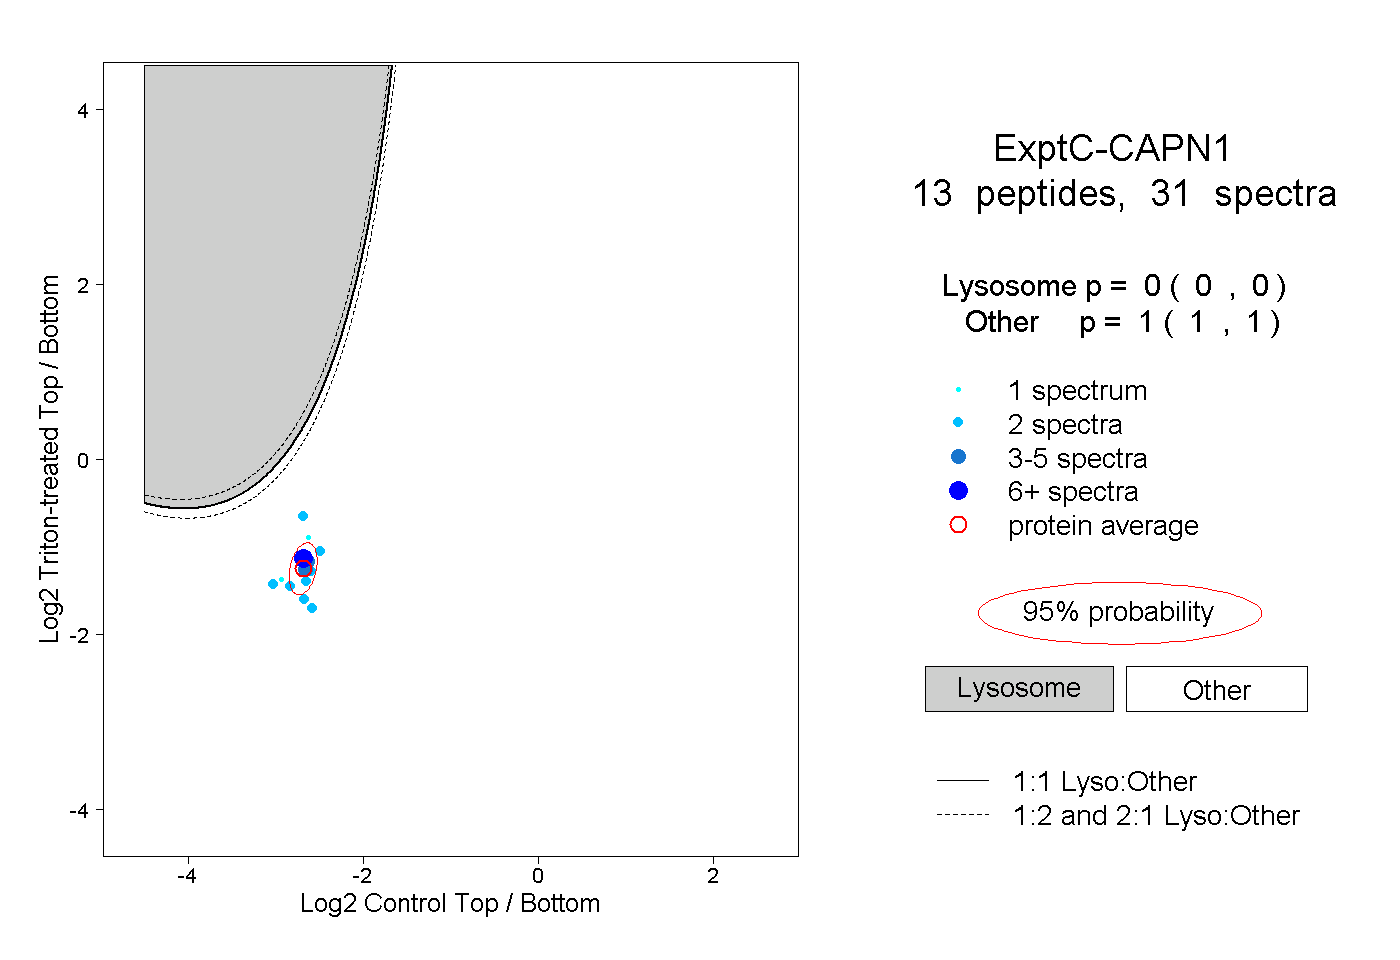 |
0.000 0.000 | 0.000 |
1.000 1.000 | 1.000 |