15
15peptides
spectra
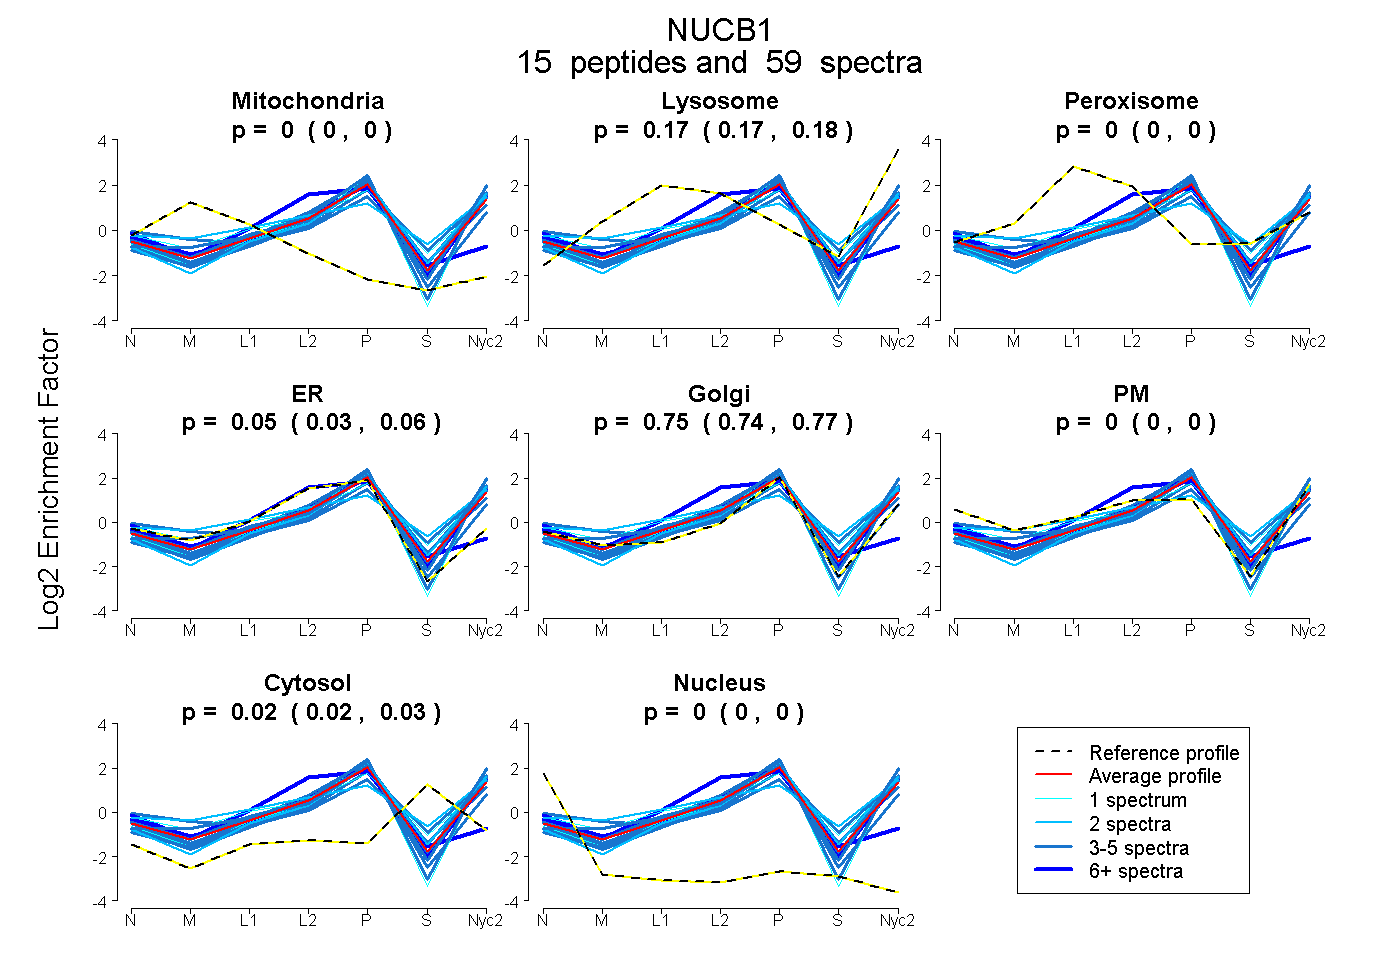
0.000 | 0.000
0.166 | 0.178
0.000 | 0.000
0.033 | 0.063
0.739 | 0.768
0.000 | 0.000
0.018 | 0.029
0.000 | 0.000
8peptides
spectra
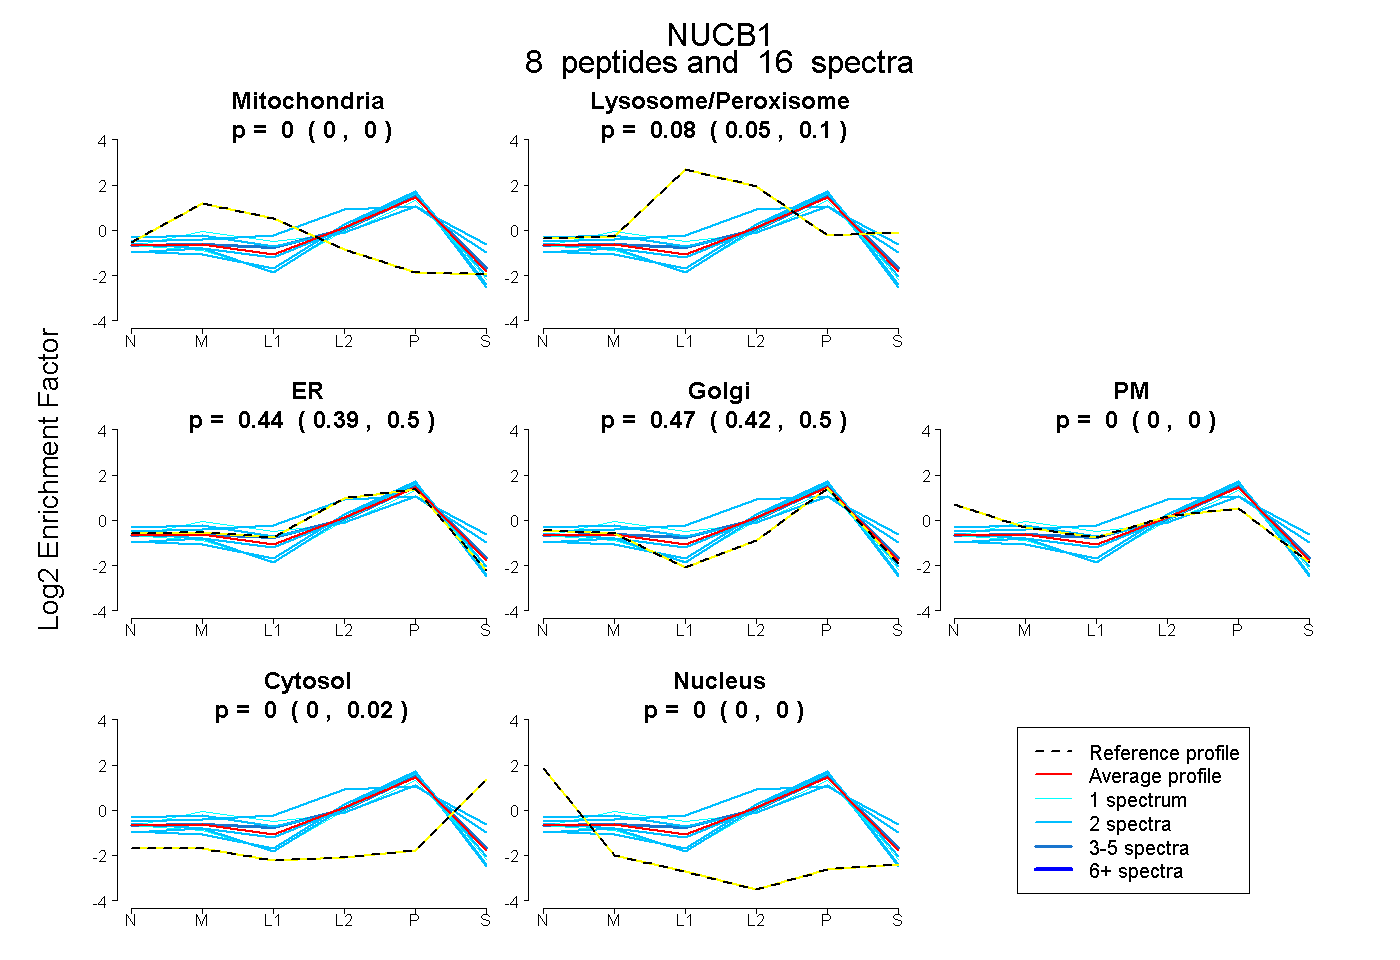
0.000 | 0.000
0.050 | 0.103
0.385 | 0.502
0.418 | 0.503
0.000 | 0.000
0.000 | 0.018
0.000 | 0.000
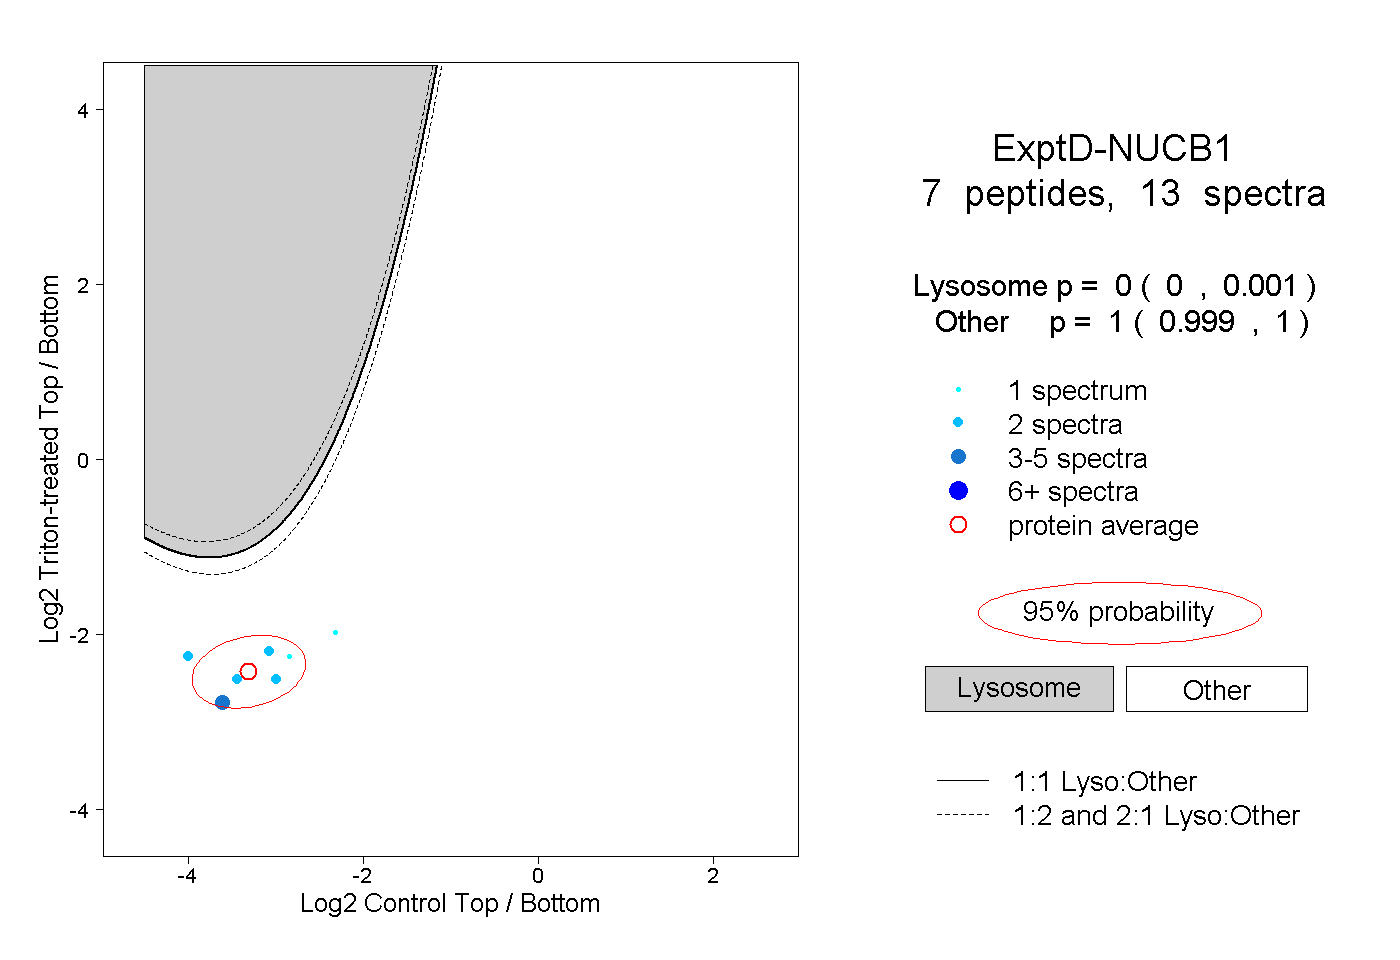
16peptides
spectra
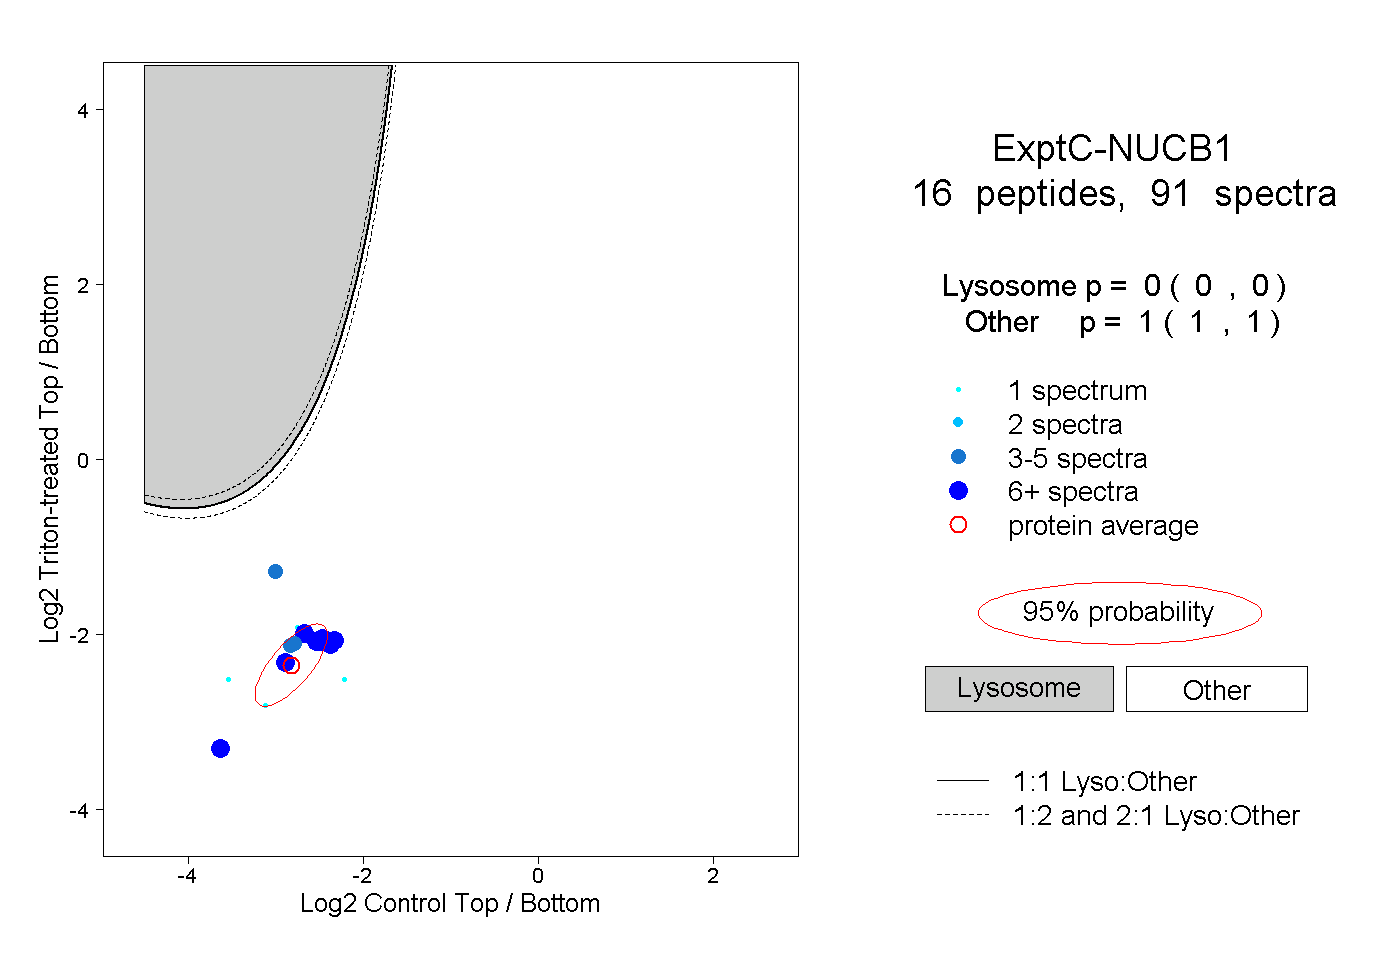
0.000 | 0.000
1.000 | 1.000