 15
15peptides
spectra
0.000 | 0.000
0.166 | 0.178
0.000 | 0.000
0.033 | 0.063
0.739 | 0.768
0.000 | 0.000
0.018 | 0.029
0.000 | 0.000
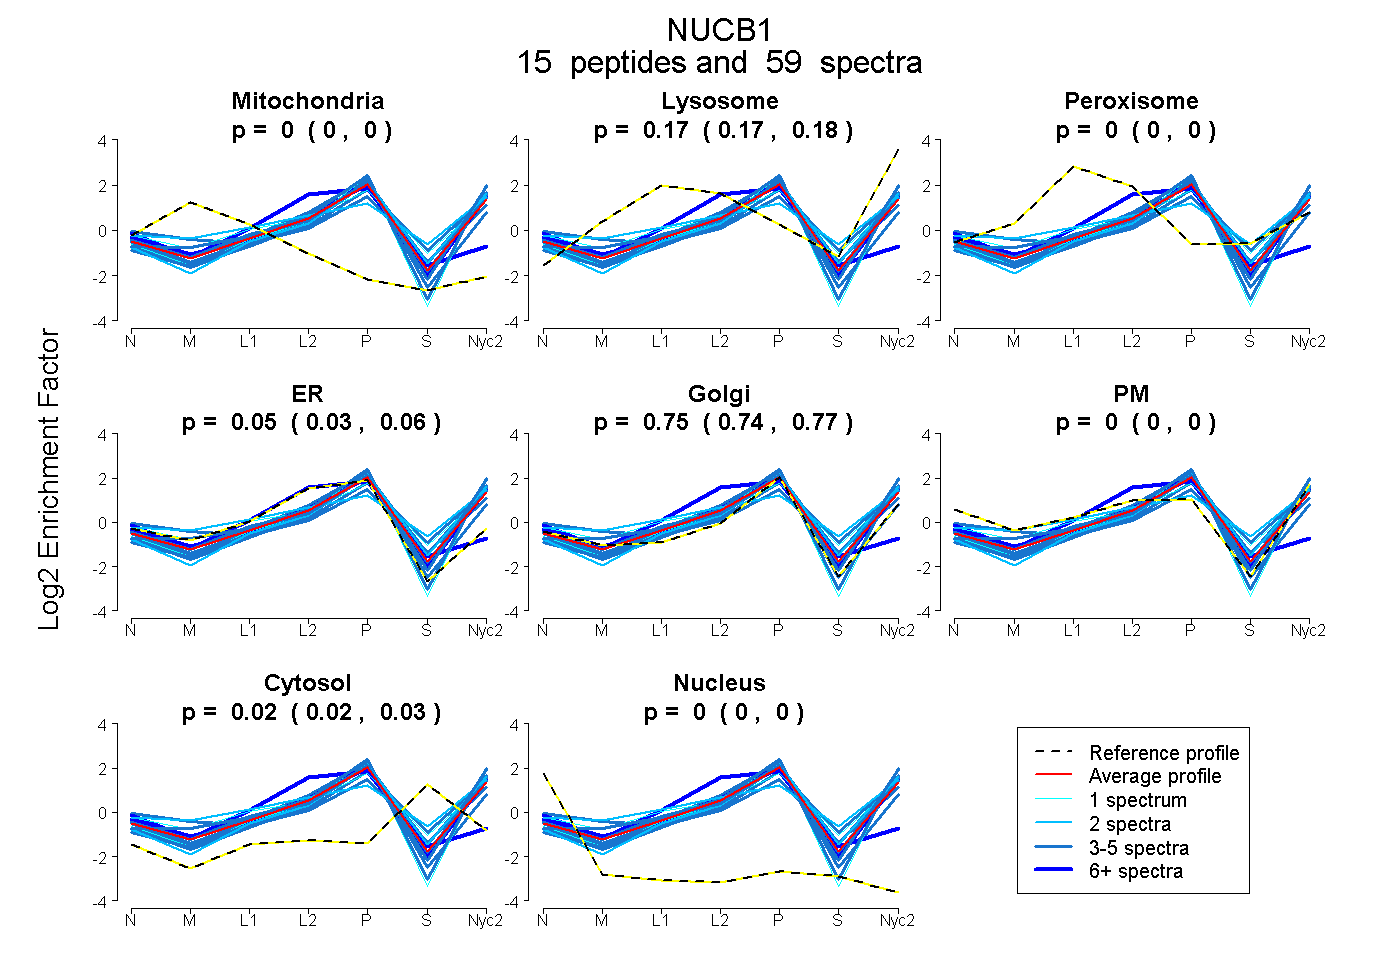
| Plot | Mito | Lyso | Perox | ER | Golgi | PM | Cytosol | Nucleus | |||||
| Expt A |
15 peptides |
59 spectra |
|
0.000 0.000 | 0.000 |
0.172 0.166 | 0.178 |
0.000 0.000 | 0.000 |
0.049 0.033 | 0.063 |
0.755 0.739 | 0.768 |
0.000 0.000 | 0.000 |
0.024 0.018 | 0.029 |
0.000 0.000 | 0.000 |
| 4 spectra, YLESLGEEQR | 0.000 | 0.246 | 0.000 | 0.000 | 0.754 | 0.000 | 0.000 | 0.000 | ||
| 4 spectra, QEPNLQVDHMNLLK | 0.000 | 0.201 | 0.000 | 0.000 | 0.799 | 0.000 | 0.000 | 0.000 | ||
| 3 spectra, ELQQAVLQMEQR | 0.000 | 0.186 | 0.000 | 0.000 | 0.663 | 0.000 | 0.151 | 0.000 | ||
| 2 spectra, VNVPGSQAQLK | 0.000 | 0.151 | 0.000 | 0.000 | 0.771 | 0.000 | 0.078 | 0.000 | ||
| 1 spectrum, LSQELDFVSHNVR | 0.000 | 0.168 | 0.101 | 0.000 | 0.594 | 0.064 | 0.073 | 0.000 | ||
| 1 spectrum, LVTLEEFLASTQR | 0.000 | 0.099 | 0.000 | 0.000 | 0.831 | 0.070 | 0.000 | 0.000 | ||
| 5 spectra, LSQETEALGR | 0.000 | 0.122 | 0.000 | 0.000 | 0.803 | 0.000 | 0.075 | 0.000 | ||
| 4 spectra, EAELNAR | 0.000 | 0.062 | 0.000 | 0.000 | 0.498 | 0.315 | 0.125 | 0.000 | ||
| 2 spectra, QFEHLDPQNQHTFEAR | 0.000 | 0.231 | 0.085 | 0.000 | 0.285 | 0.246 | 0.153 | 0.000 | ||
| 3 spectra, DVPASEK | 0.000 | 0.031 | 0.000 | 0.342 | 0.626 | 0.000 | 0.000 | 0.000 | ||
| 12 spectra, LQEEER | 0.000 | 0.000 | 0.022 | 0.858 | 0.000 | 0.000 | 0.120 | 0.000 | ||
| 4 spectra, NVDTNQDR | 0.000 | 0.164 | 0.000 | 0.000 | 0.836 | 0.000 | 0.000 | 0.000 | ||
| 6 spectra, LQAANAEDIK | 0.000 | 0.142 | 0.000 | 0.022 | 0.733 | 0.103 | 0.000 | 0.000 | ||
| 4 spectra, FEEELAAR | 0.000 | 0.185 | 0.000 | 0.000 | 0.762 | 0.000 | 0.053 | 0.000 | ||
| 4 spectra, EFGETAEGWK | 0.000 | 0.122 | 0.000 | 0.000 | 0.846 | 0.000 | 0.032 | 0.000 |
| Plot | Mito | Lyso or Perox | ER | Golgi | PM | Cytosol | Nucleus | ||||||
| Expt B |
8 peptides |
16 spectra |
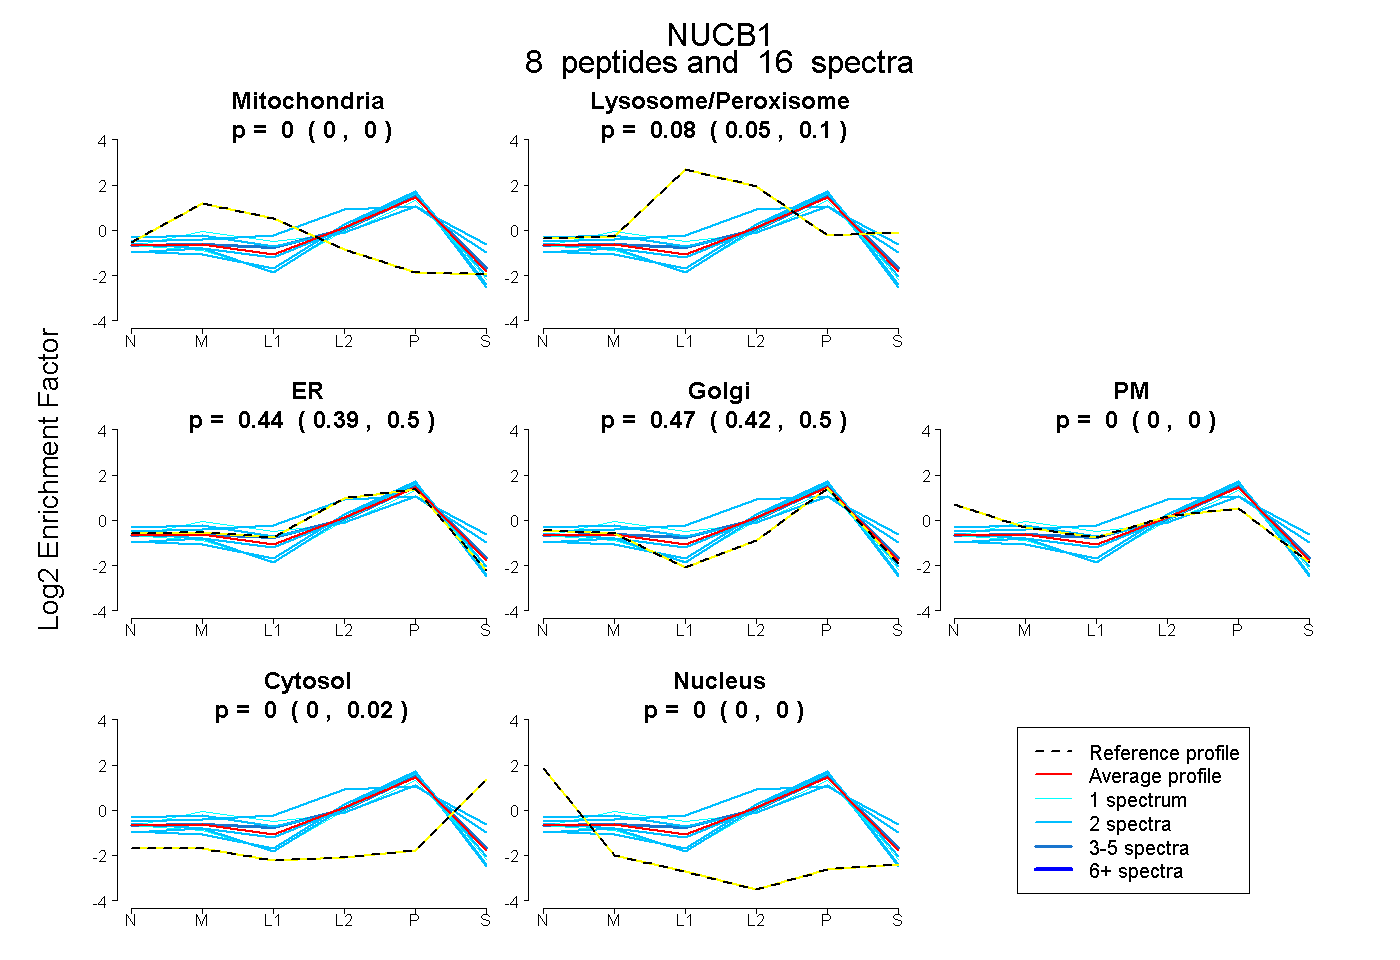 |
0.000 0.000 | 0.000 |
0.082 0.050 | 0.103 |
0.442 0.385 | 0.502 |
0.474 0.418 | 0.503 |
0.000 0.000 | 0.000 |
0.001 0.000 | 0.018 |
0.000 0.000 | 0.000 |
|||
| Plot | Lyso | Other | |||||||||||
| Expt C |
16 peptides |
91 spectra |
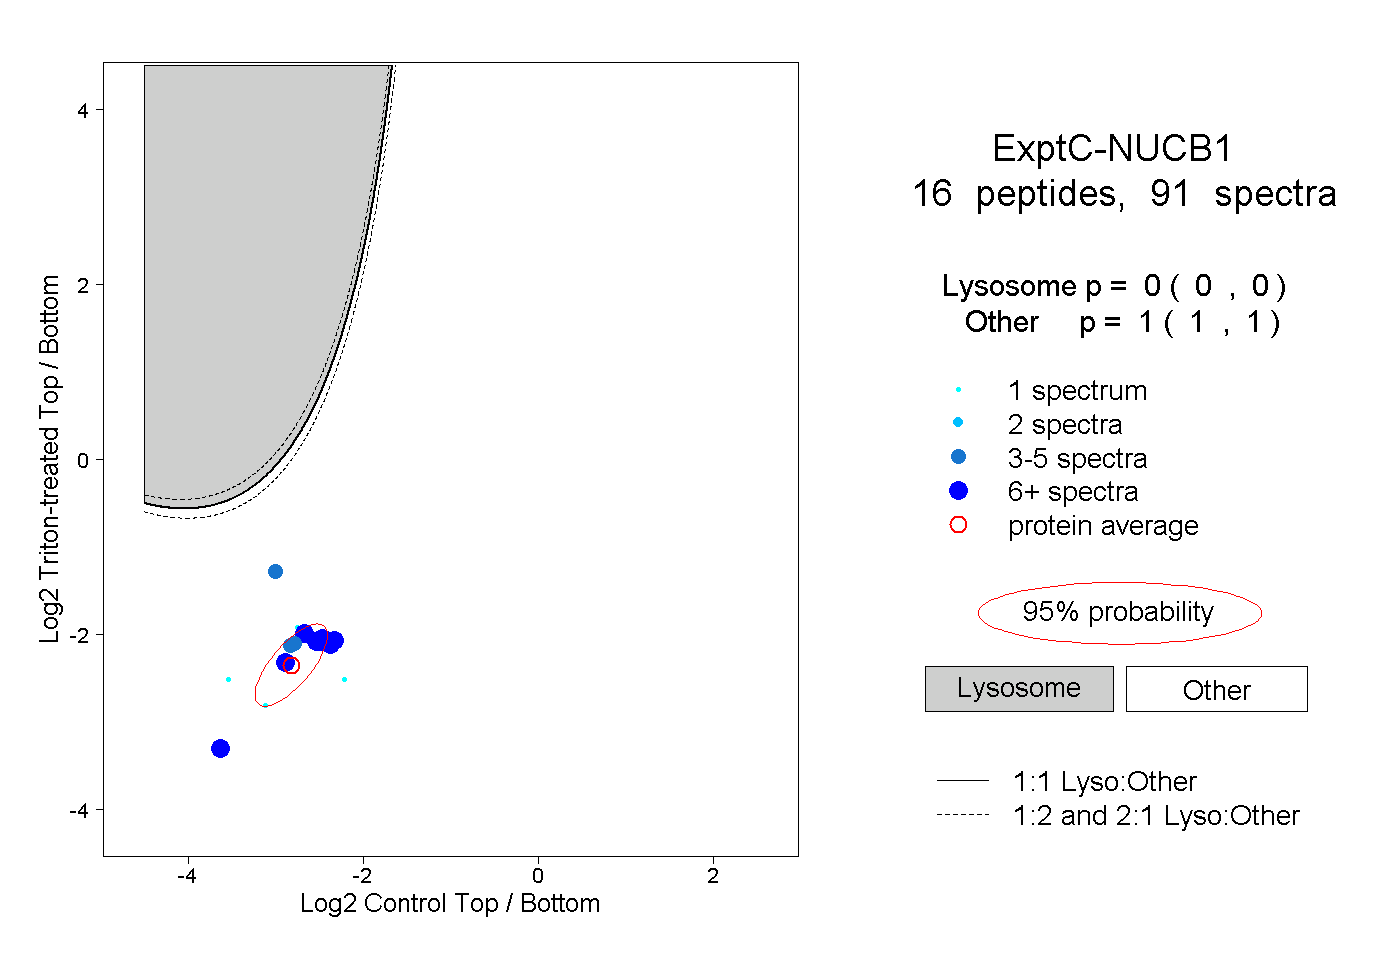 |
0.000 0.000 | 0.000 |
1.000 1.000 | 1.000 |
||||||||
| Plot | Lyso | Other | |||||||||||
| Expt D |
7 peptides |
13 spectra |
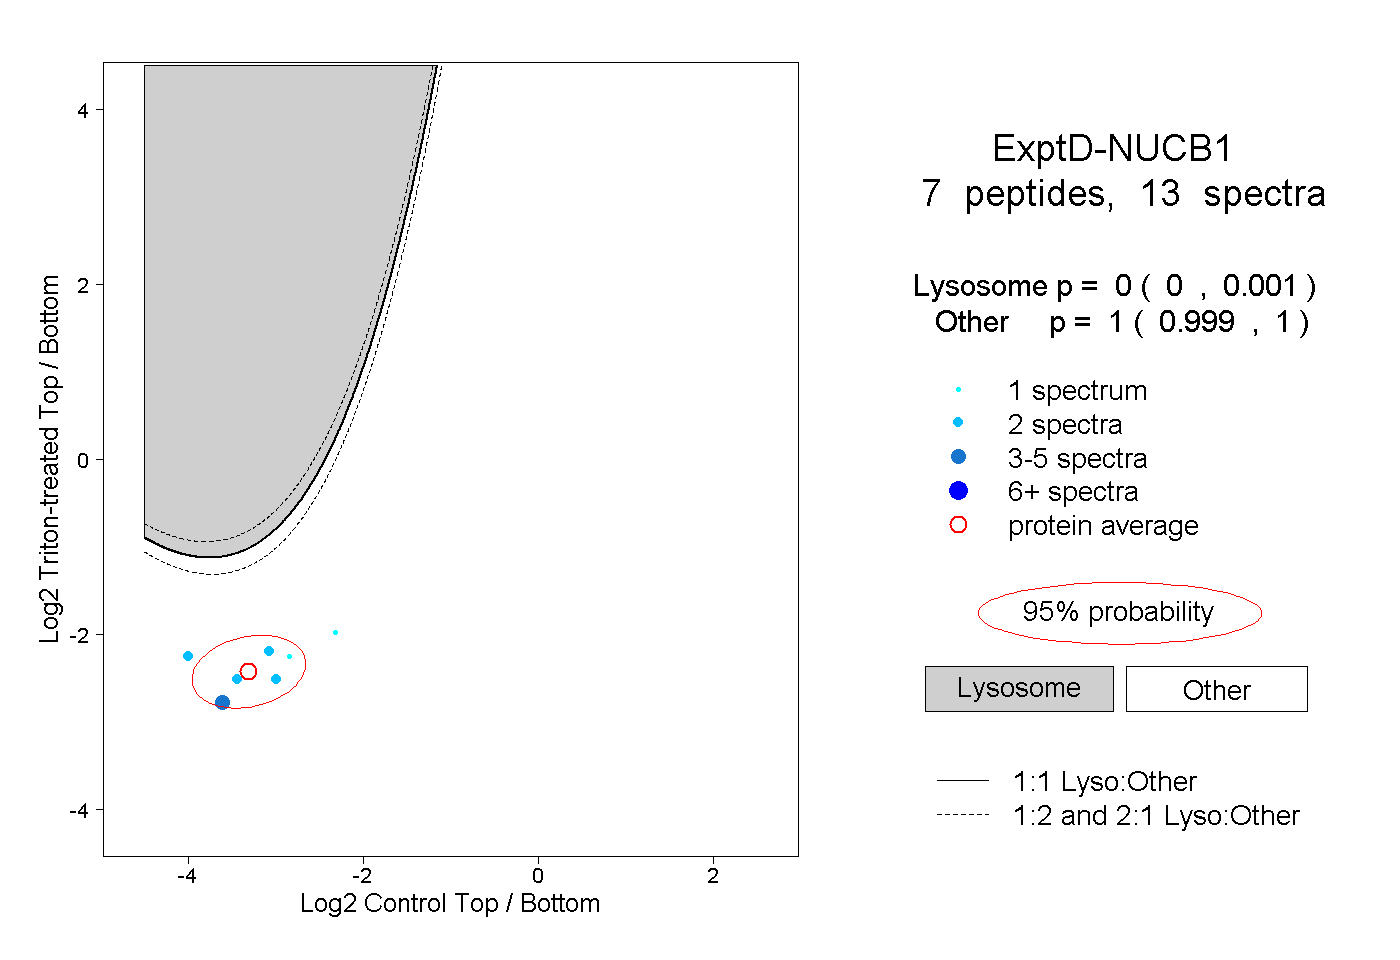 |
0.000 0.000 | 0.001 |
1.000 0.999 | 1.000 |