8
8peptides
spectra
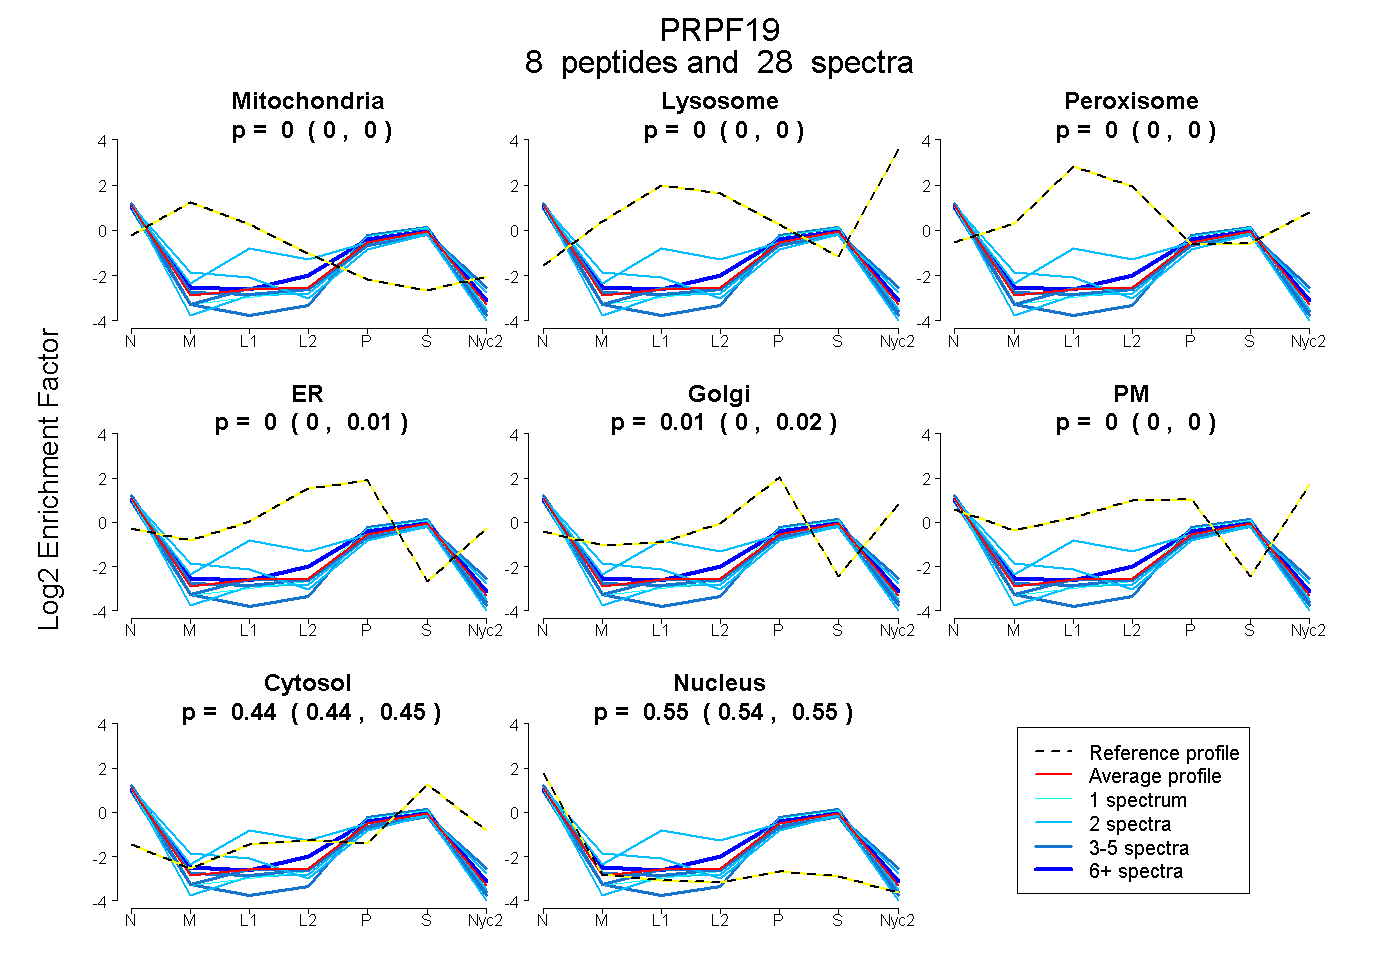
0.000 | 0.000
0.000 | 0.000
0.000 | 0.000
0.000 | 0.014
0.000 | 0.016
0.000 | 0.000
0.439 | 0.448
0.537 | 0.553
4peptides
spectra
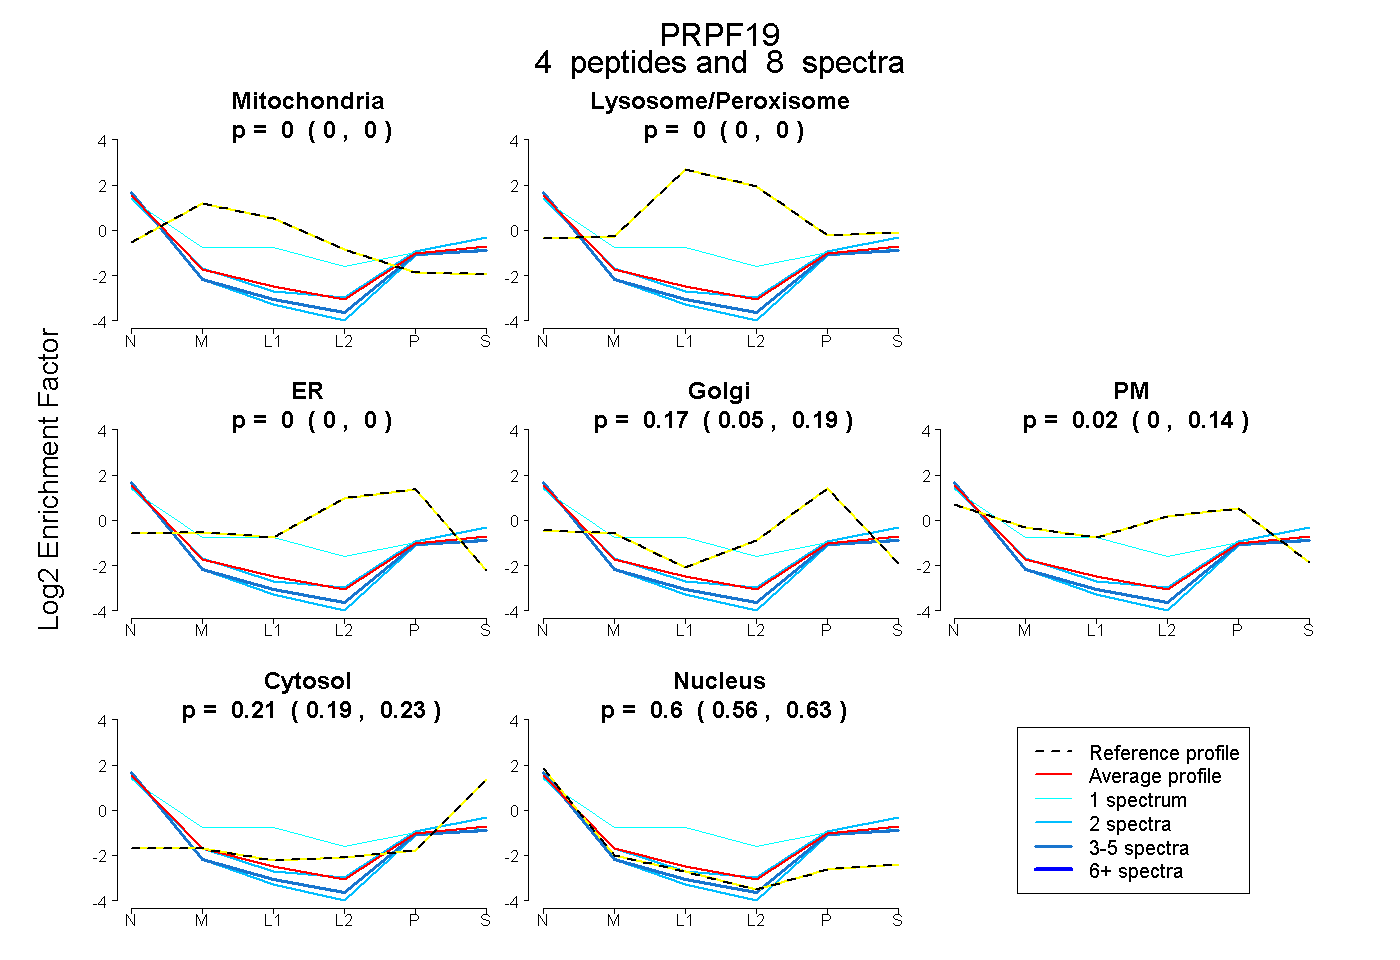
0.000 | 0.000
0.000 | 0.000
0.000 | 0.000
0.048 | 0.189
0.000 | 0.145
0.192 | 0.229
0.558 | 0.634