12
12peptides
spectra
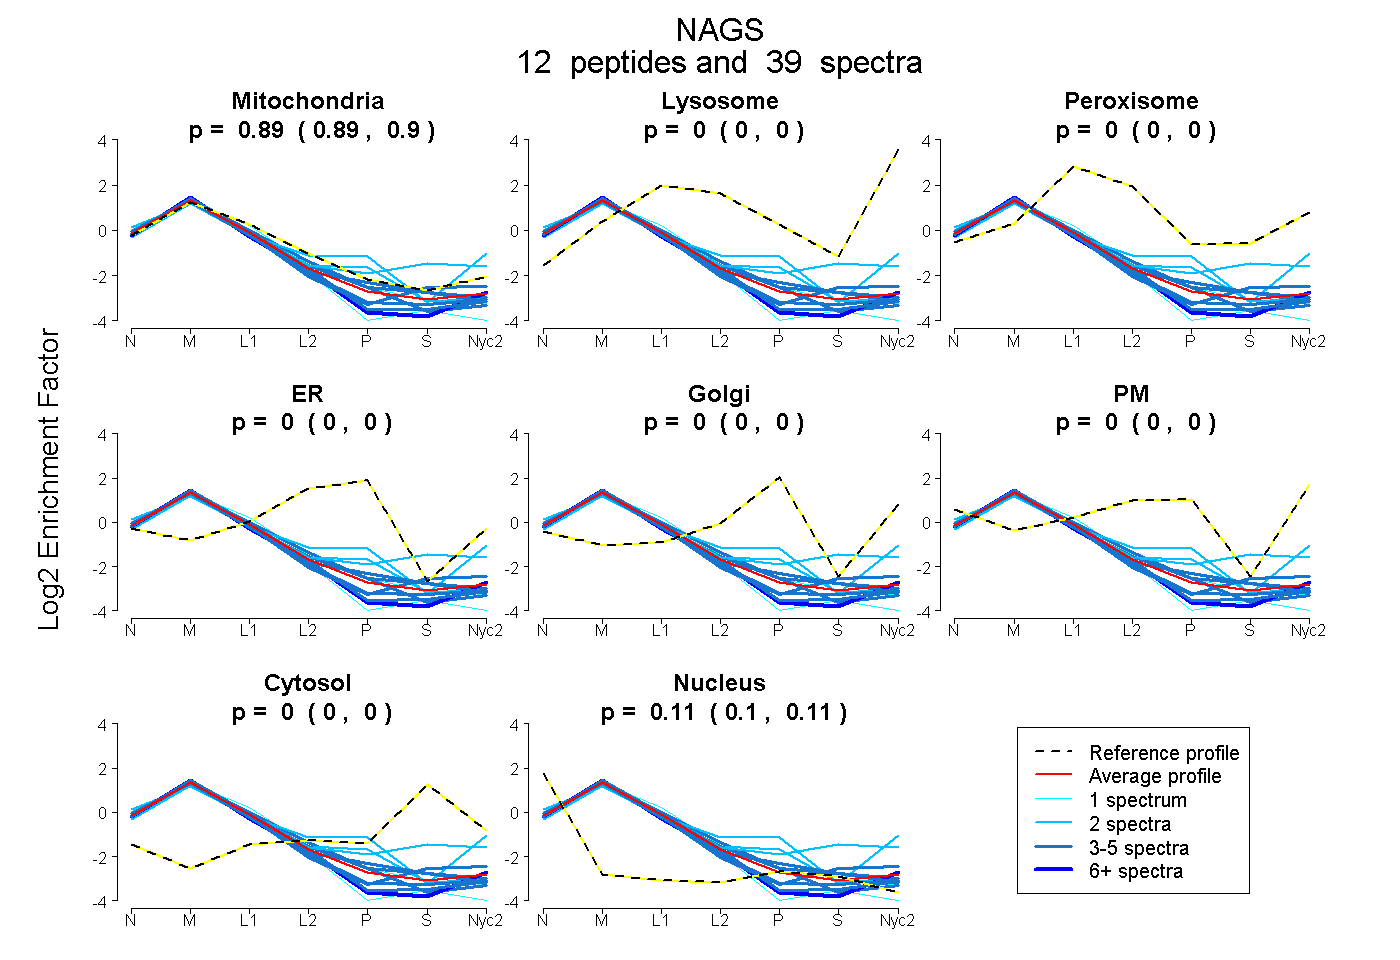
0.891 | 0.897
0.000 | 0.000
0.000 | 0.000
0.000 | 0.000
0.000 | 0.000
0.000 | 0.000
0.000 | 0.000
0.102 | 0.109
12peptides
spectra
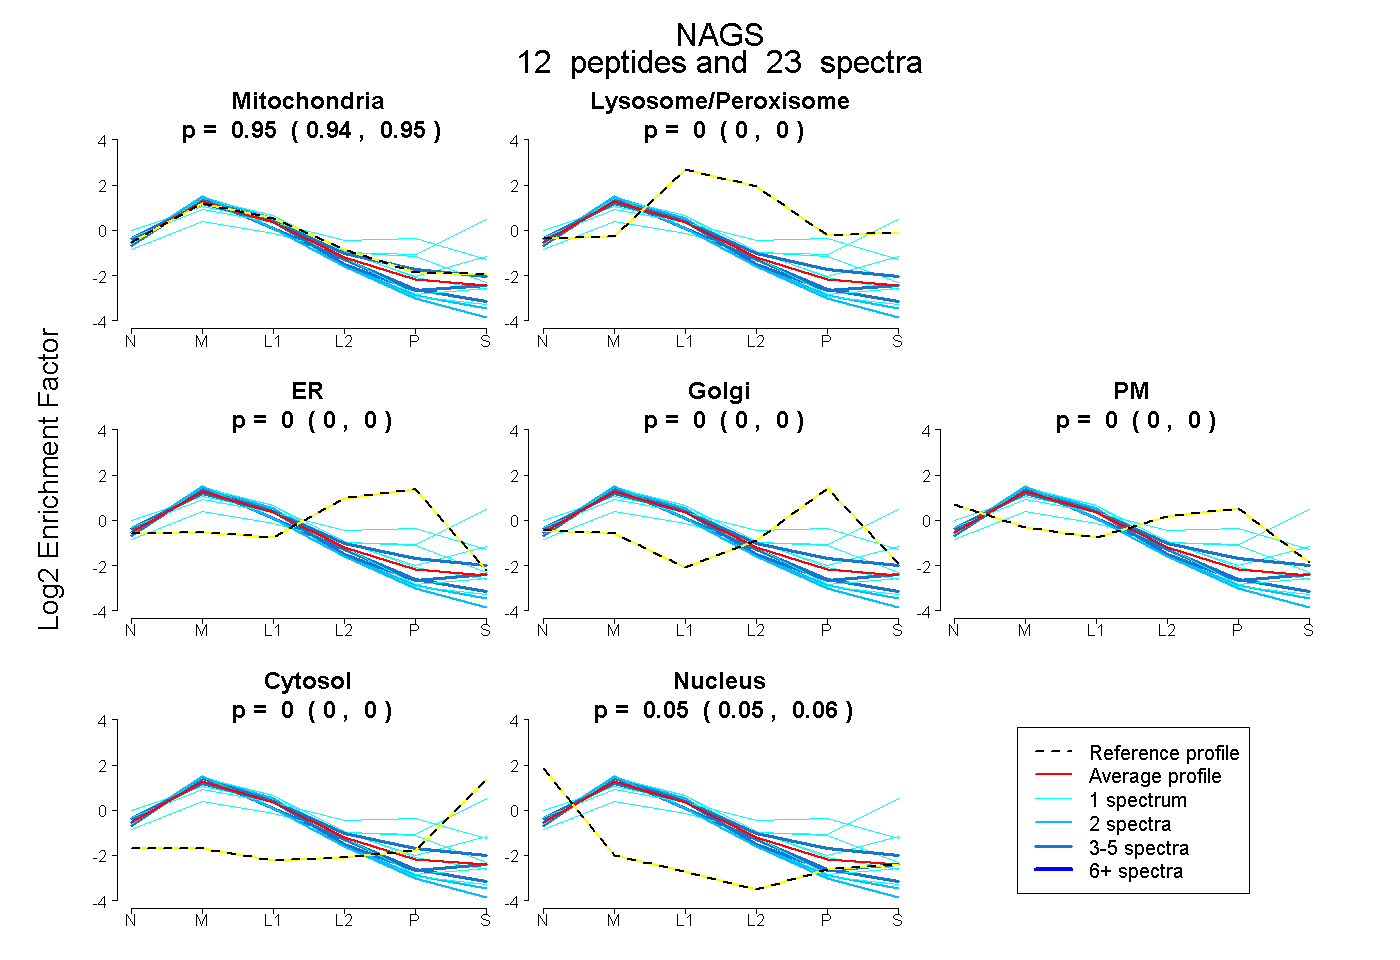
0.939 | 0.950
0.000 | 0.000
0.000 | 0.000
0.000 | 0.000
0.000 | 0.000
0.000 | 0.000
0.049 | 0.060
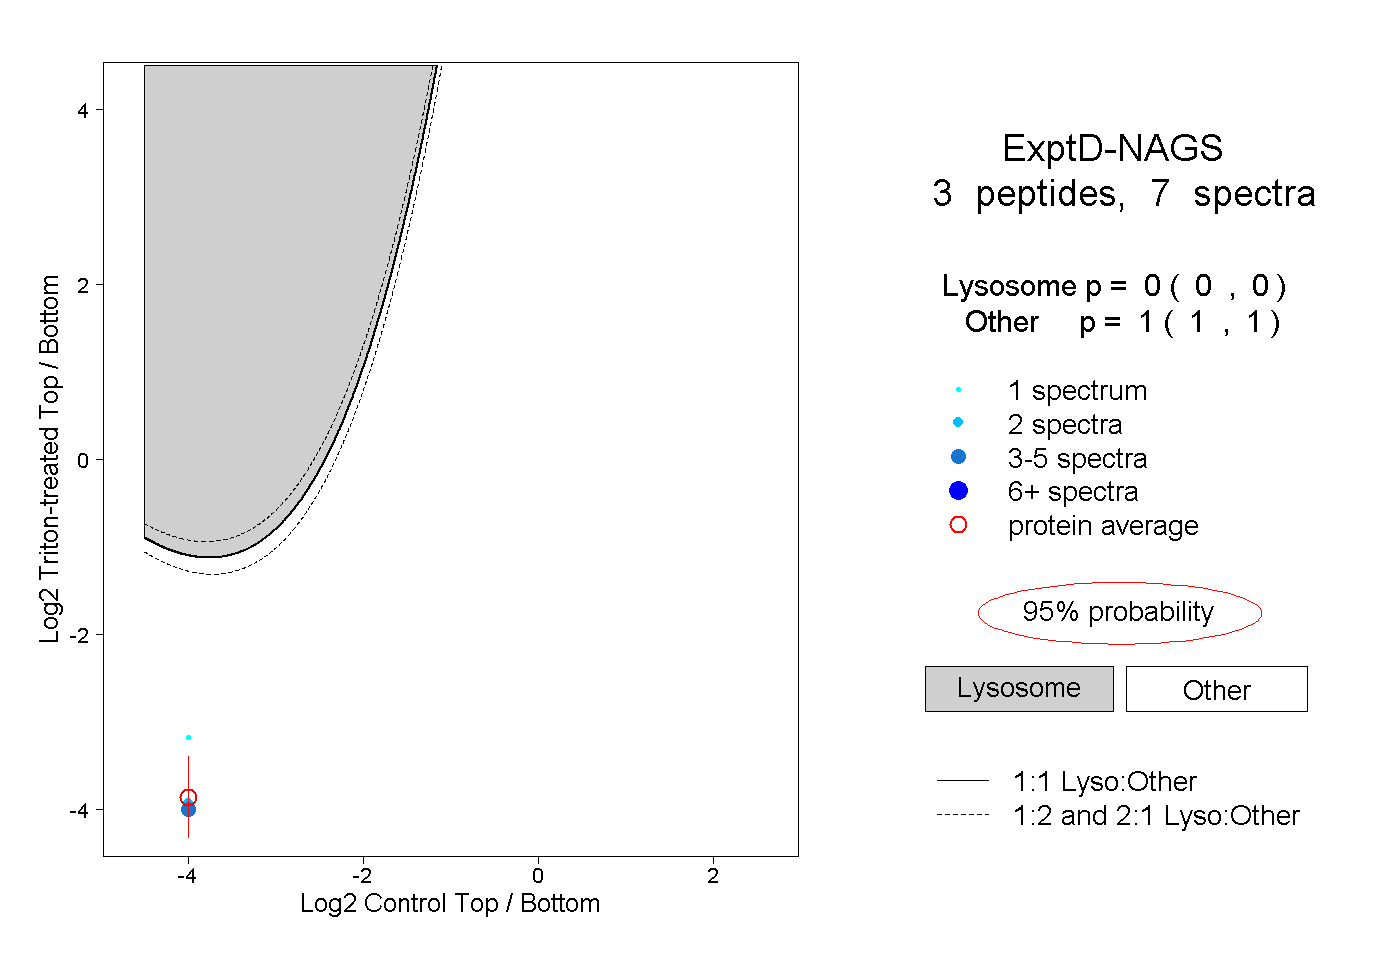
17peptides
spectra
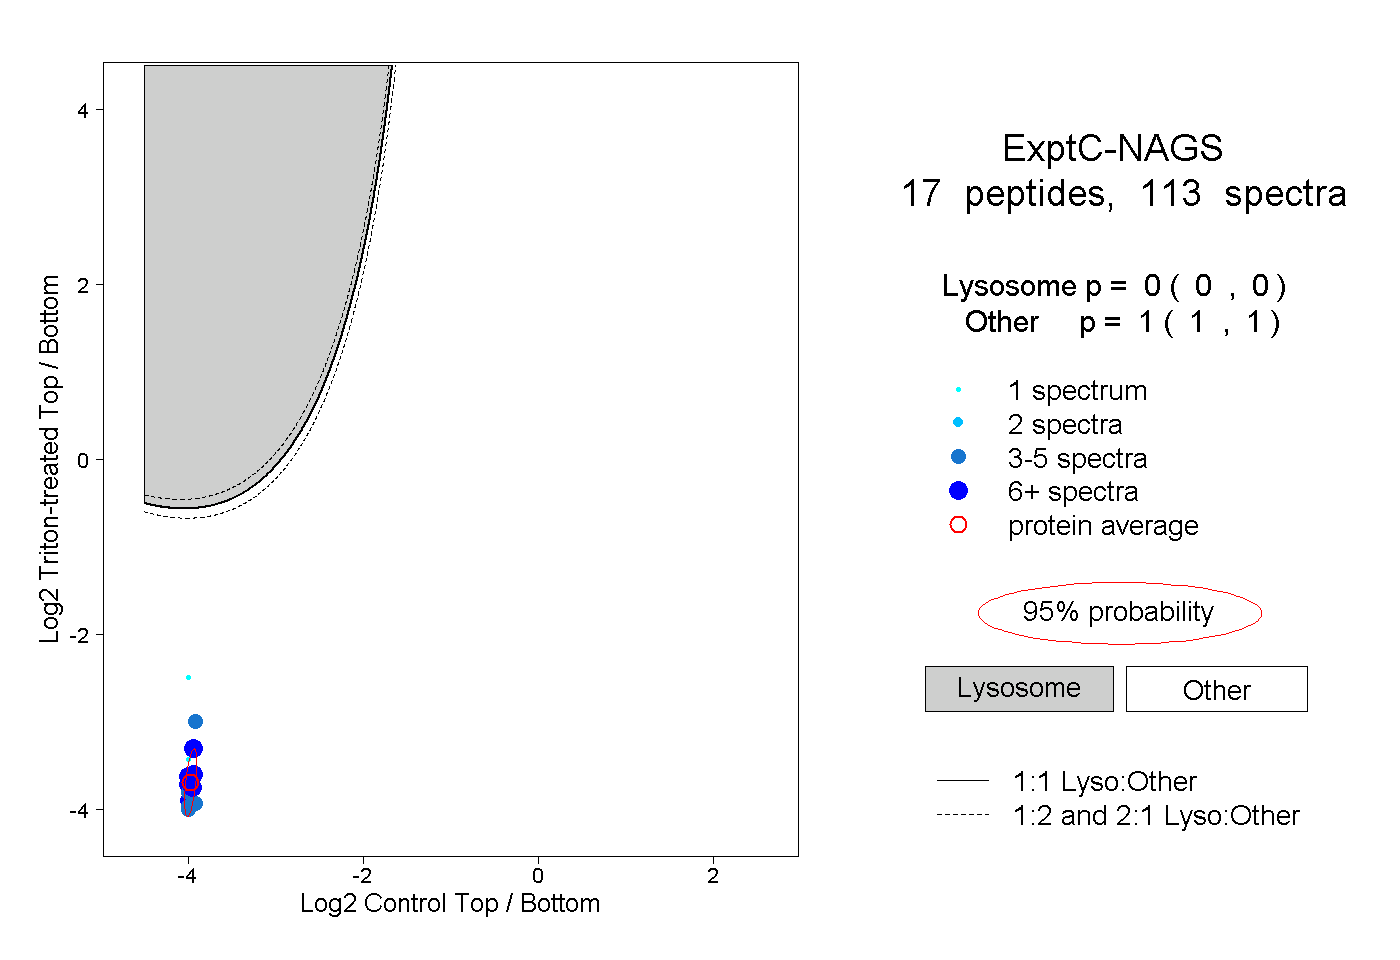
0.000 | 0.000
1.000 | 1.000