NAGS
[ENSRNOP00000028332]
Main page
| | | Plot |
Mito |
Lyso |
|
Perox |
ER |
Golgi |
PM |
Cytosol |
Nucleus |
|
| Expt A |
 12
12
peptides |
39
spectra |
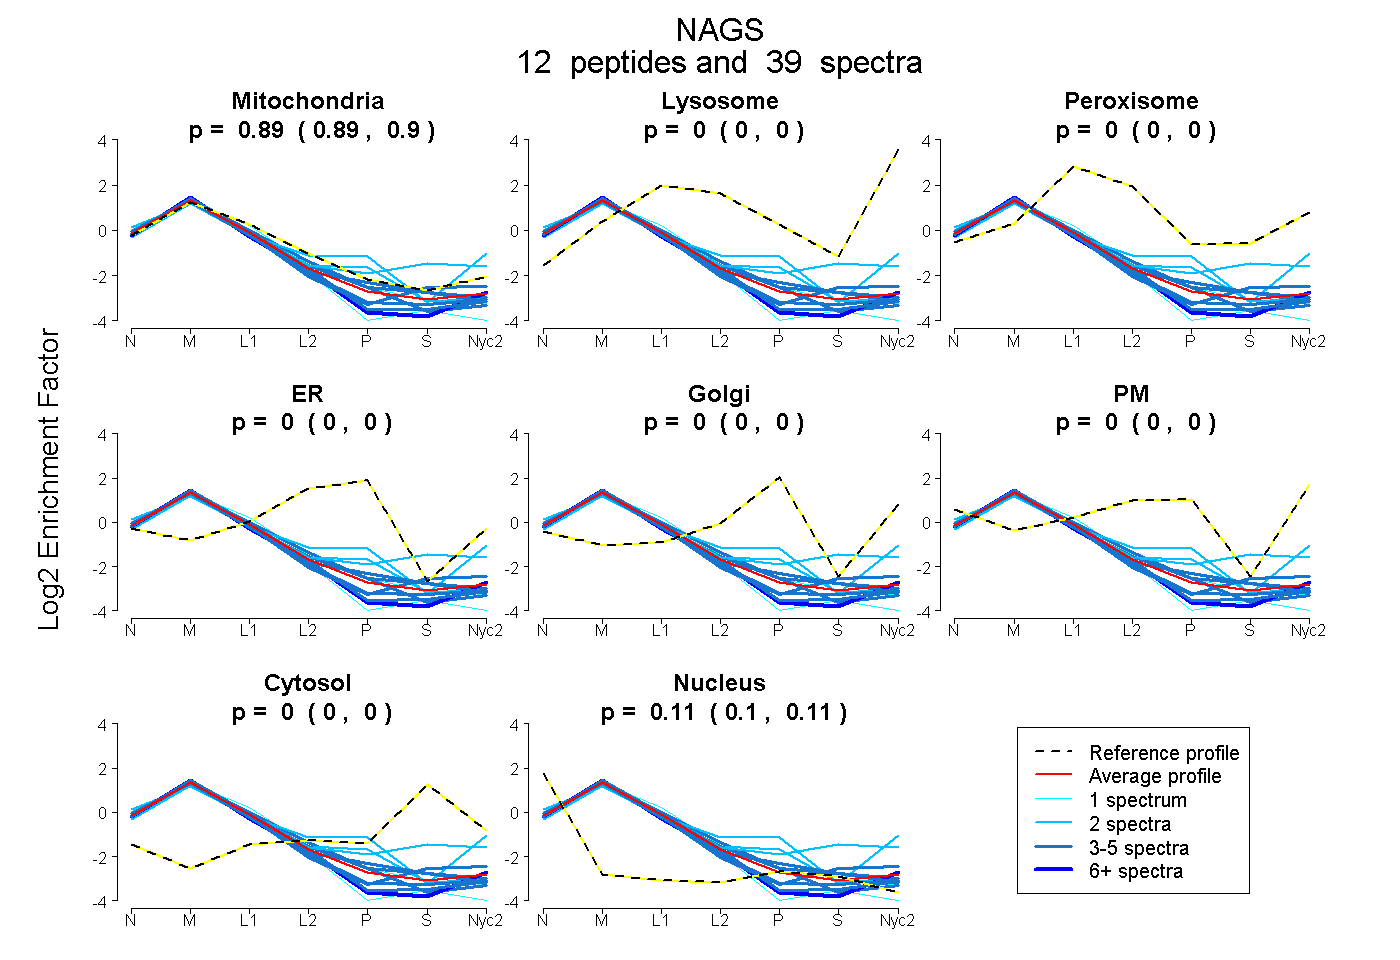 |
0.894
0.891 | 0.897 |
0.000
0.000 | 0.000 |
|
0.000
0.000 | 0.000 |
0.000
0.000 | 0.000 |
0.000
0.000 | 0.000 |
0.000
0.000 | 0.000 |
0.000
0.000 | 0.000 |
0.106
0.102 | 0.109 |
|
| | | Plot |
Mito |
|
Lyso or Perox |
|
ER |
Golgi |
PM |
Cytosol |
Nucleus |
|
| Expt B |
12
peptides |
23
spectra |
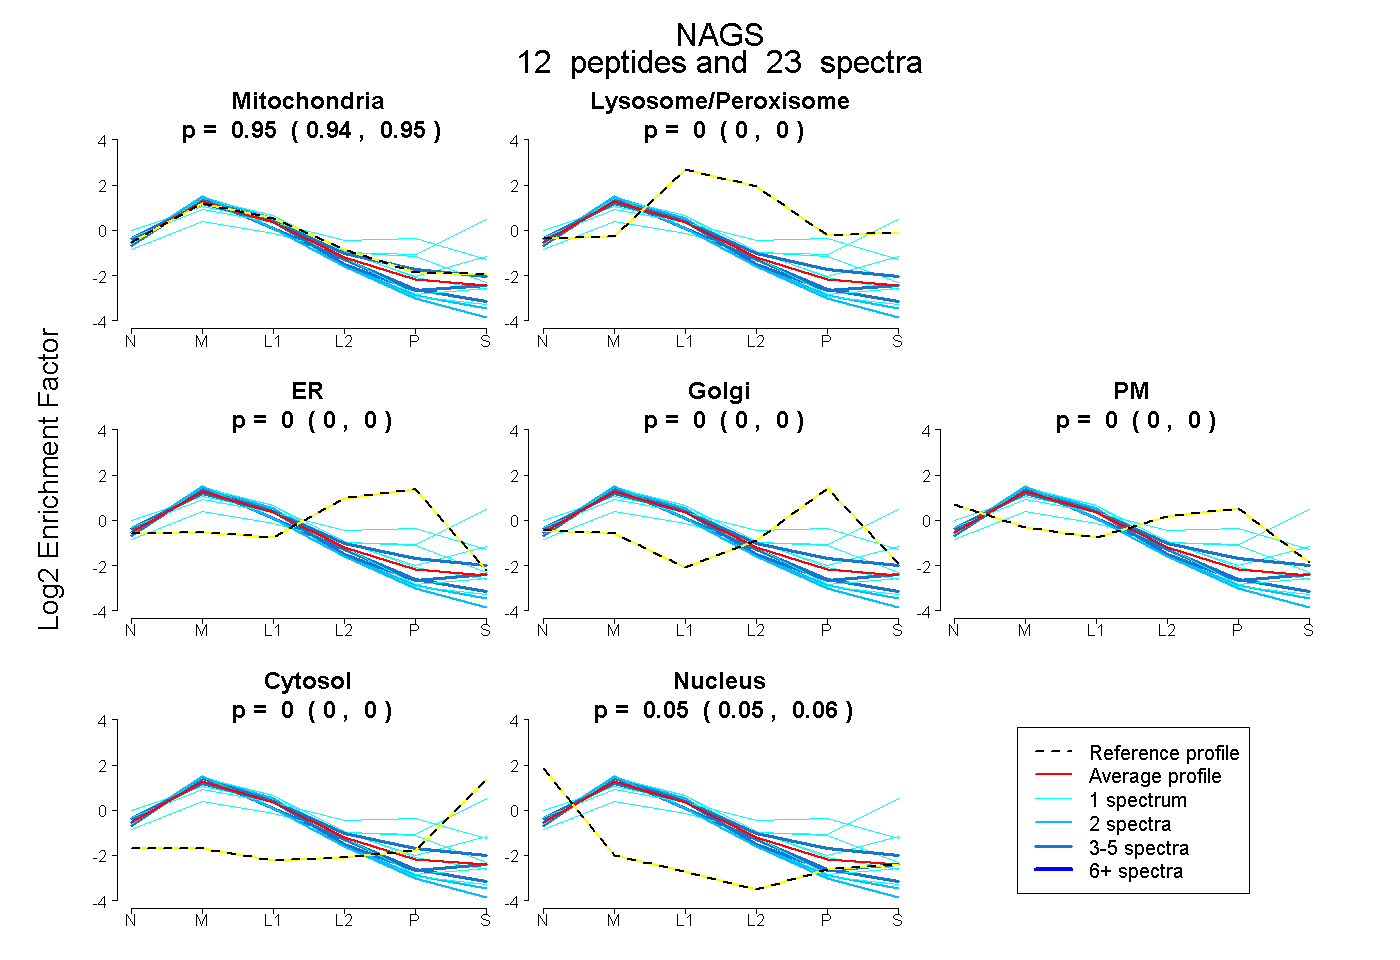 |
0.945
0.939 | 0.950 |
|
0.000
0.000 | 0.000 |
|
0.000
0.000 | 0.000 |
0.000
0.000 | 0.000 |
0.000
0.000 | 0.000 |
0.000
0.000 | 0.000 |
0.055
0.049 | 0.060 |
|
| 4 spectra, LIVDVLSR |
0.935 |
|
0.000 |
|
0.000 |
0.000 |
0.000 |
0.000 |
0.065 |
|
| 3 spectra, FVVSSSR |
0.912 |
|
0.000 |
|
0.000 |
0.000 |
0.000 |
0.000 |
0.088 |
|
| 1 spectrum, AQLAQSCK |
0.820 |
|
0.064 |
|
0.000 |
0.000 |
0.000 |
0.062 |
0.054 |
|
| 1 spectrum, AHVEDNEGTK |
1.000 |
|
0.000 |
|
0.000 |
0.000 |
0.000 |
0.000 |
0.000 |
|
| 2 spectra, SLDSLDQGR |
0.874 |
|
0.000 |
|
0.000 |
0.000 |
0.000 |
0.000 |
0.126 |
|
| 2 spectra, DLQTLFWR |
0.930 |
|
0.000 |
|
0.000 |
0.000 |
0.000 |
0.000 |
0.070 |
|
| 1 spectrum, IIFLNNSGGLR |
0.921 |
|
0.000 |
|
0.000 |
0.000 |
0.000 |
0.000 |
0.079 |
|
| 5 spectra, VLVNELR |
0.940 |
|
0.000 |
|
0.000 |
0.031 |
0.000 |
0.000 |
0.029 |
|
| 1 spectrum, VTNPINPWYFK |
0.535 |
|
0.204 |
|
0.000 |
0.260 |
0.000 |
0.000 |
0.000 |
|
| 1 spectrum, LVNLVNASFGK |
0.982 |
|
0.000 |
|
0.000 |
0.000 |
0.000 |
0.000 |
0.018 |
|
| 1 spectrum, ALQPTK |
0.864 |
|
0.000 |
|
0.022 |
0.079 |
0.035 |
0.000 |
0.000 |
|
| 1 spectrum, GCGTLFK |
0.346 |
|
0.226 |
|
0.000 |
0.000 |
0.000 |
0.428 |
0.000 |
|
| | | Plot |
|
Lyso |
|
|
|
|
|
|
|
Other |
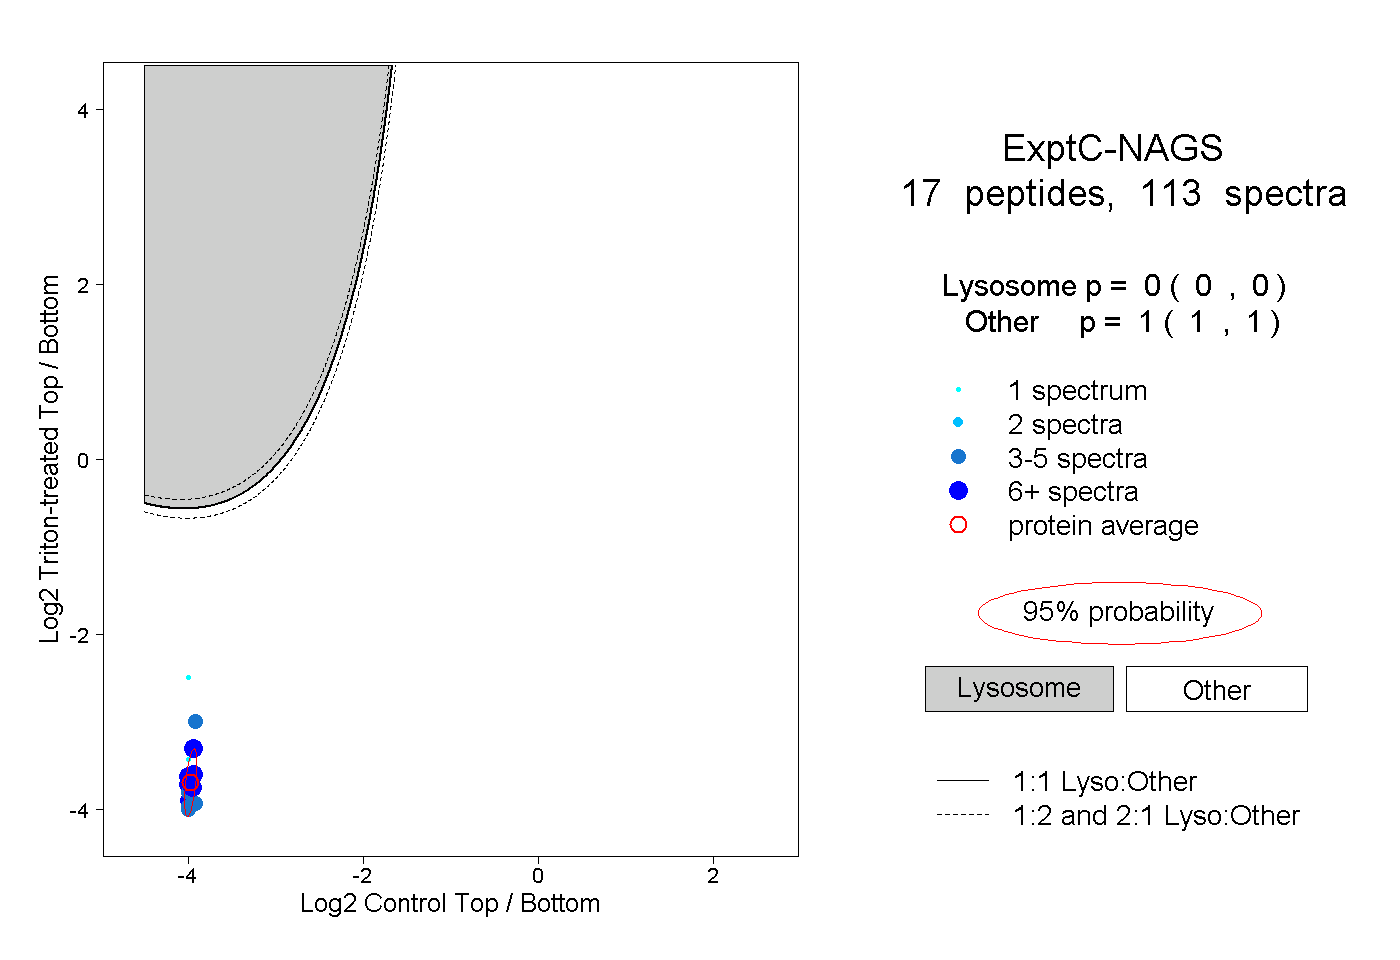
| Expt C |
17
peptides |
113
spectra |
 |
|
0.000
0.000 | 0.000 |
|
|
|
|
|
|
|
1.000
1.000 | 1.000 |
| | | Plot |
|
Lyso |
|
|
|
|
|
|
|
Other |
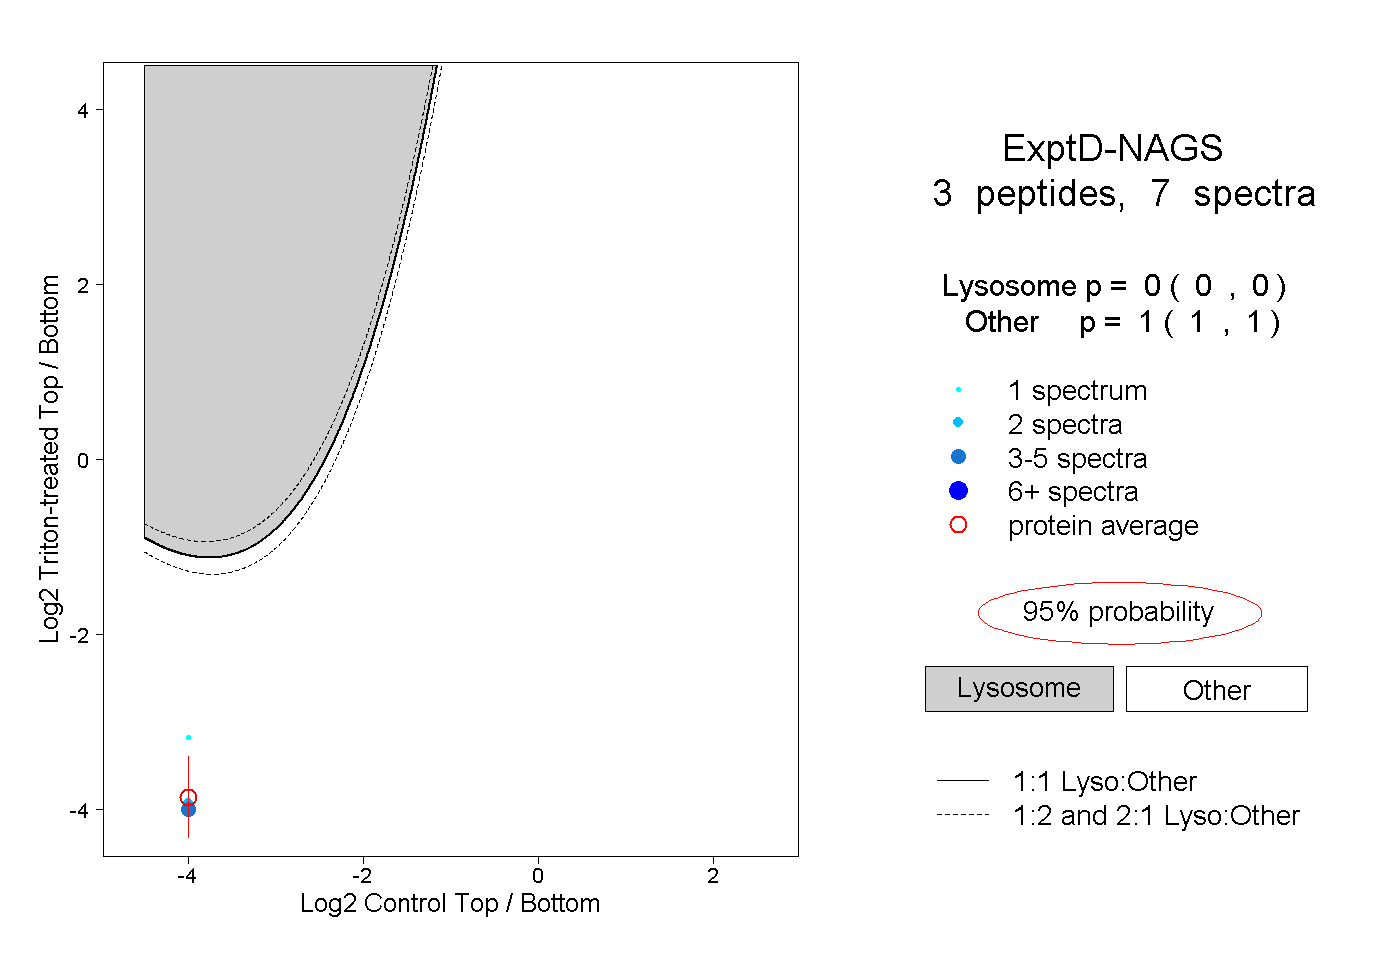
| Expt D |
3
peptides |
7
spectra |
 |
|
0.000
0.000 | 0.000 |
|
|
|
|
|
|
|
1.000
1.000 | 1.000 |