 12
12peptides
spectra
0.891 | 0.897
0.000 | 0.000
0.000 | 0.000
0.000 | 0.000
0.000 | 0.000
0.000 | 0.000
0.000 | 0.000
0.102 | 0.109
| Plot | Mito | Lyso | Perox | ER | Golgi | PM | Cytosol | Nucleus | |||||
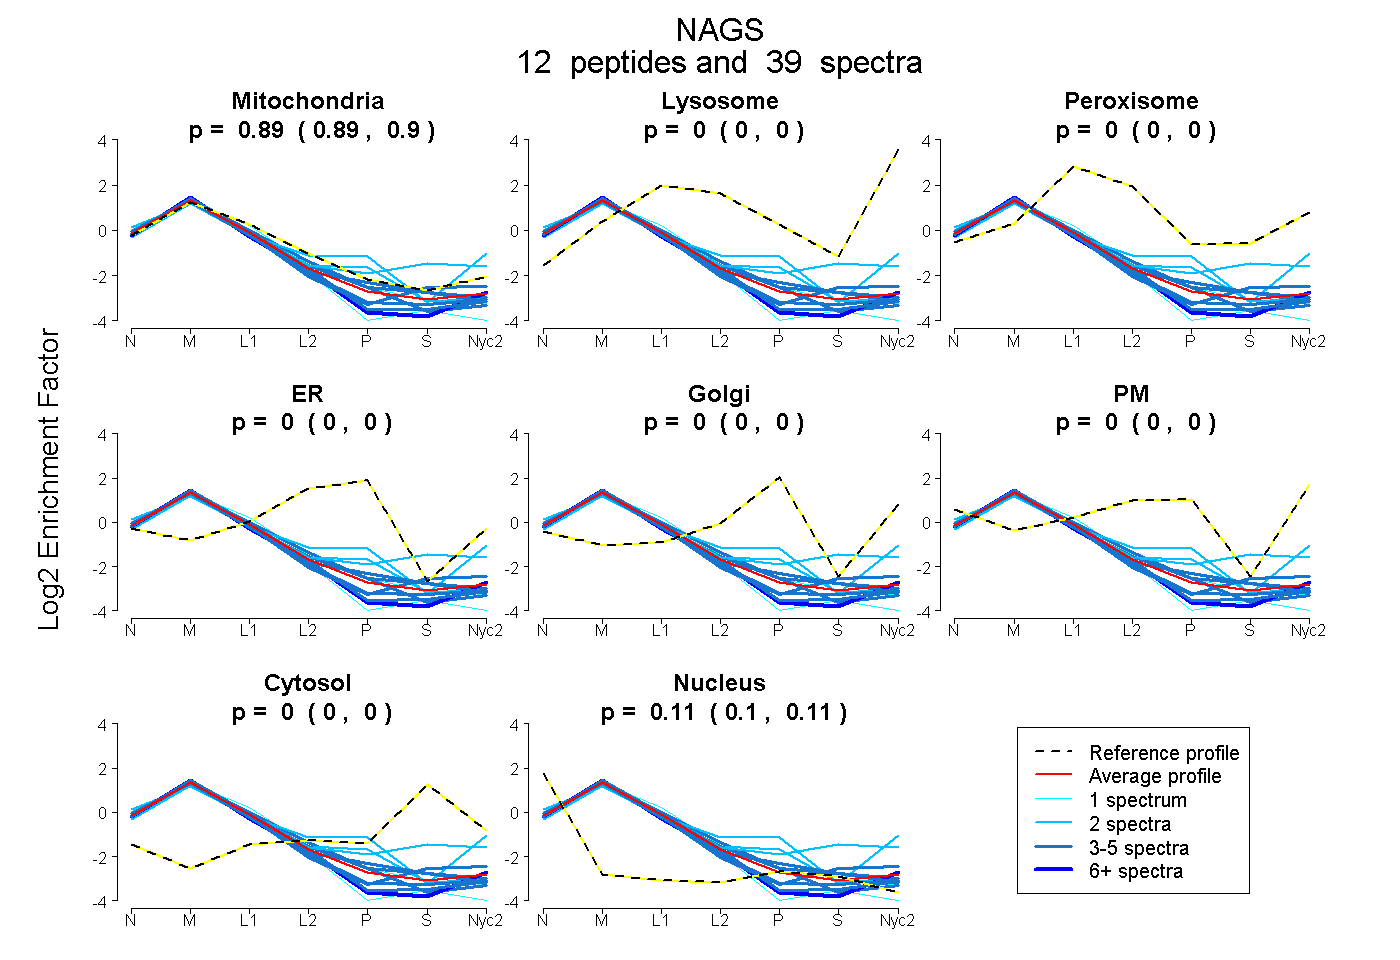
| Expt A |
12 peptides |
39 spectra |
|
0.894 0.891 | 0.897 |
0.000 0.000 | 0.000 |
0.000 0.000 | 0.000 |
0.000 0.000 | 0.000 |
0.000 0.000 | 0.000 |
0.000 0.000 | 0.000 |
0.000 0.000 | 0.000 |
0.106 0.102 | 0.109 |
| 4 spectra, LIVDVLSR | 0.870 | 0.000 | 0.000 | 0.000 | 0.000 | 0.000 | 0.000 | 0.130 | ||
| 5 spectra, FVVSSSR | 0.893 | 0.000 | 0.000 | 0.000 | 0.000 | 0.000 | 0.000 | 0.107 | ||
| 2 spectra, EDYLESLRPR | 0.913 | 0.000 | 0.000 | 0.000 | 0.000 | 0.000 | 0.000 | 0.087 | ||
| 1 spectrum, AQLAQSCK | 0.904 | 0.000 | 0.000 | 0.000 | 0.000 | 0.000 | 0.000 | 0.096 | ||
| 4 spectra, SLDSLDQGR | 0.873 | 0.000 | 0.000 | 0.000 | 0.000 | 0.000 | 0.000 | 0.127 | ||
| 4 spectra, DLQTLFWR | 0.900 | 0.000 | 0.000 | 0.000 | 0.000 | 0.000 | 0.000 | 0.100 | ||
| 1 spectrum, DIQAFLNQCGASPGEAR | 0.832 | 0.000 | 0.000 | 0.000 | 0.000 | 0.000 | 0.000 | 0.168 | ||
| 7 spectra, IIFLNNSGGLR | 0.878 | 0.000 | 0.000 | 0.000 | 0.000 | 0.000 | 0.000 | 0.122 | ||
| 4 spectra, VLVNELR | 0.858 | 0.000 | 0.000 | 0.000 | 0.000 | 0.000 | 0.000 | 0.142 | ||
| 3 spectra, VTNPINPWYFK | 0.883 | 0.000 | 0.000 | 0.000 | 0.000 | 0.000 | 0.000 | 0.117 | ||
| 2 spectra, DSYELVNHAK | 0.744 | 0.000 | 0.000 | 0.000 | 0.128 | 0.108 | 0.000 | 0.020 | ||
| 2 spectra, GCGTLFK | 0.817 | 0.007 | 0.000 | 0.000 | 0.000 | 0.000 | 0.176 | 0.000 |
| Plot | Mito | Lyso or Perox | ER | Golgi | PM | Cytosol | Nucleus | ||||||
| Expt B |
12 peptides |
23 spectra |
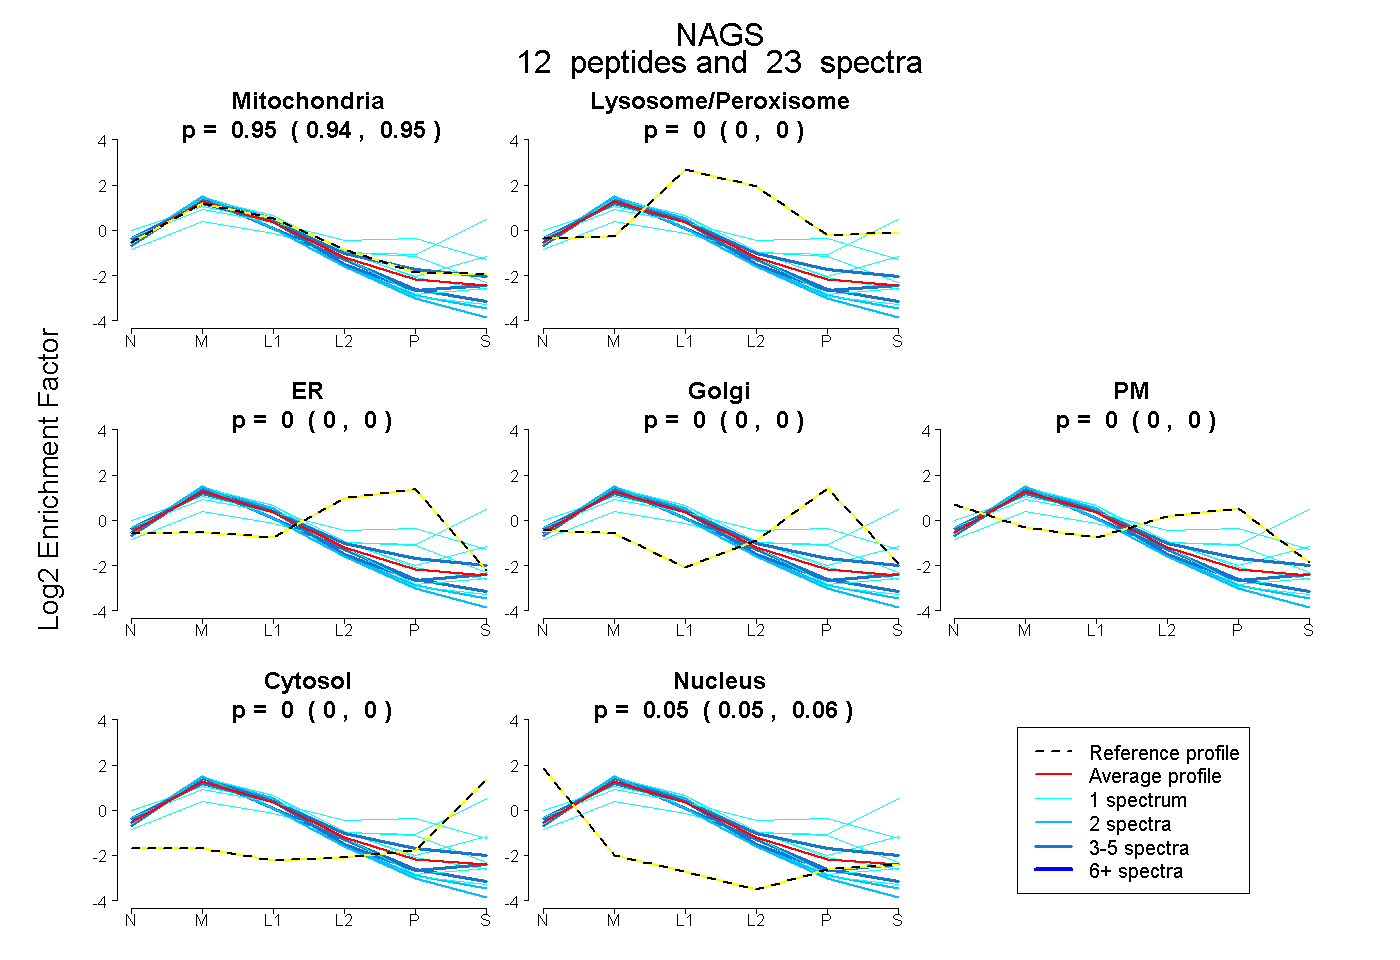 |
0.945 0.939 | 0.950 |
0.000 0.000 | 0.000 |
0.000 0.000 | 0.000 |
0.000 0.000 | 0.000 |
0.000 0.000 | 0.000 |
0.000 0.000 | 0.000 |
0.055 0.049 | 0.060 |
|||
| Plot | Lyso | Other | |||||||||||
| Expt C |
17 peptides |
113 spectra |
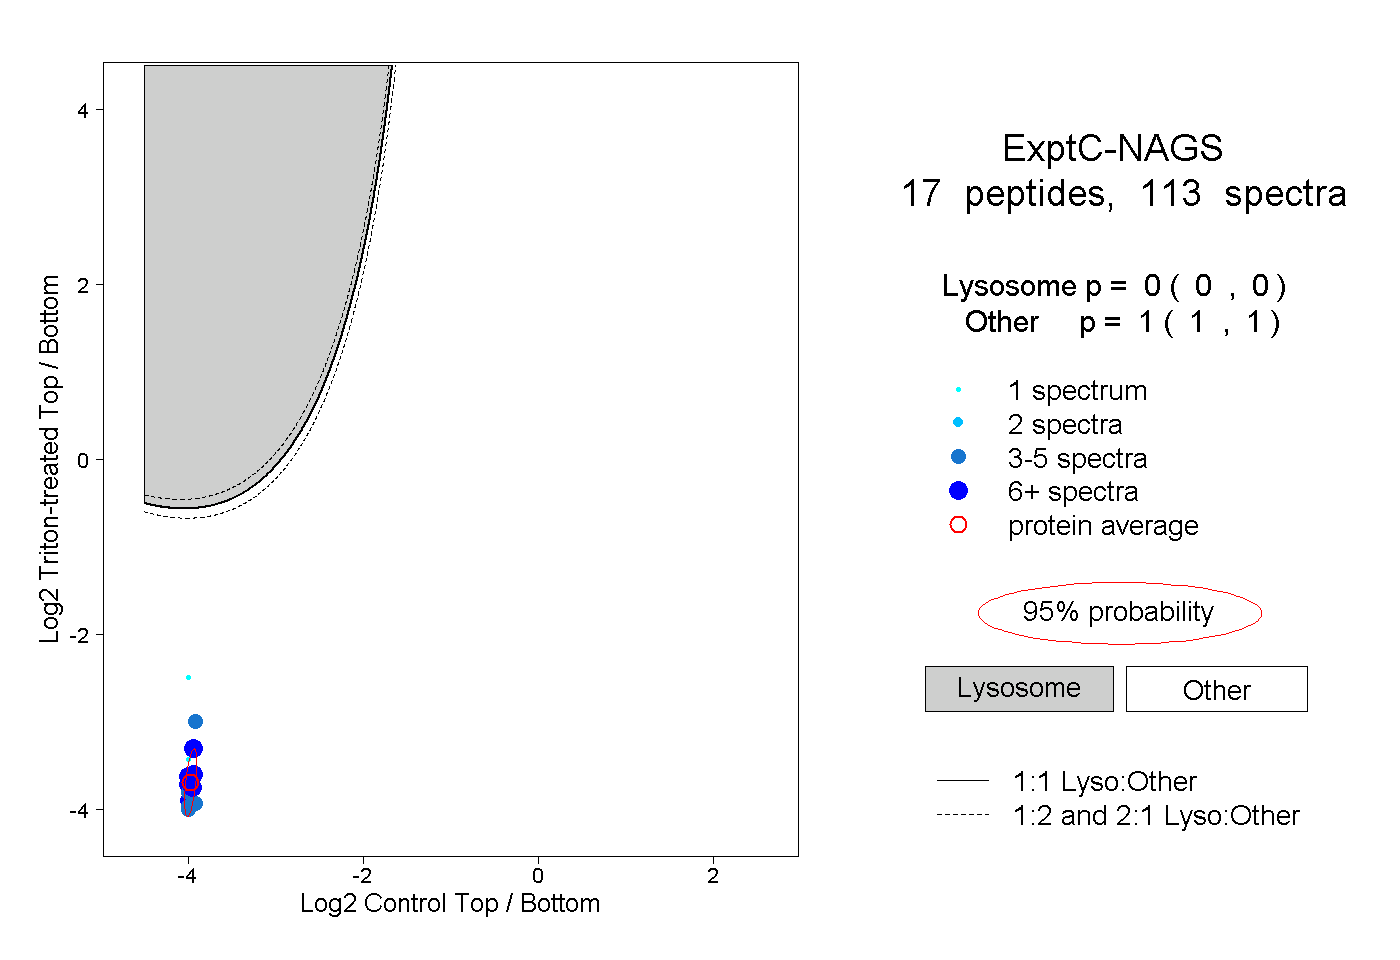 |
0.000 0.000 | 0.000 |
1.000 1.000 | 1.000 |
||||||||
| Plot | Lyso | Other | |||||||||||
| Expt D |
3 peptides |
7 spectra |
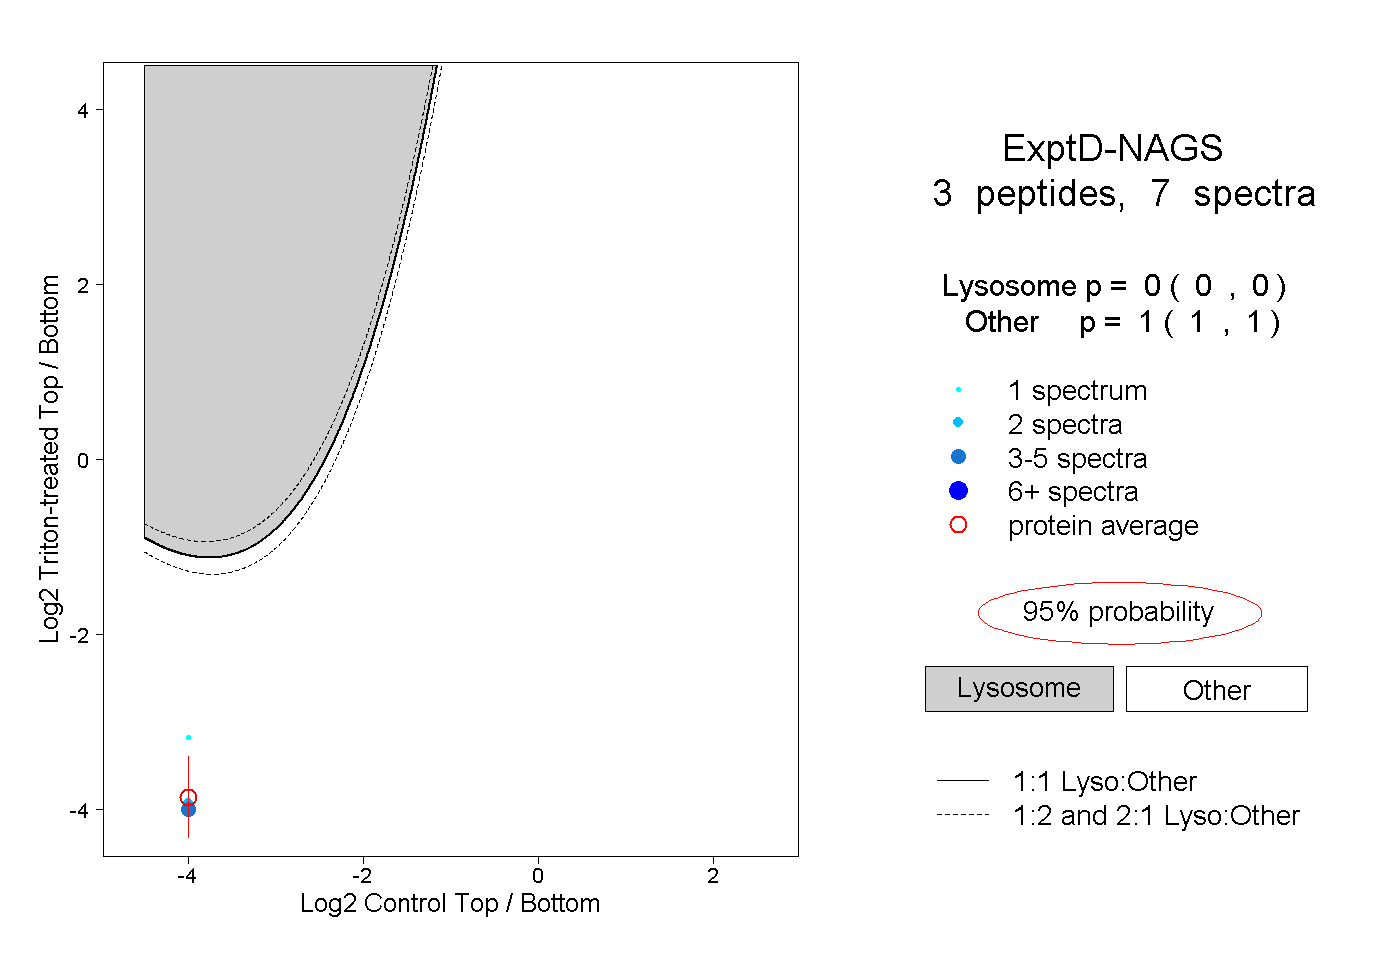 |
0.000 0.000 | 0.000 |
1.000 1.000 | 1.000 |