BAX
[ENSRNOP00000028328]
Main page
| | | Plot |
Mito |
Lyso |
|
Perox |
ER |
Golgi |
PM |
Cytosol |
Nucleus |
|
| Expt A |
 3
3
peptides |
11
spectra |
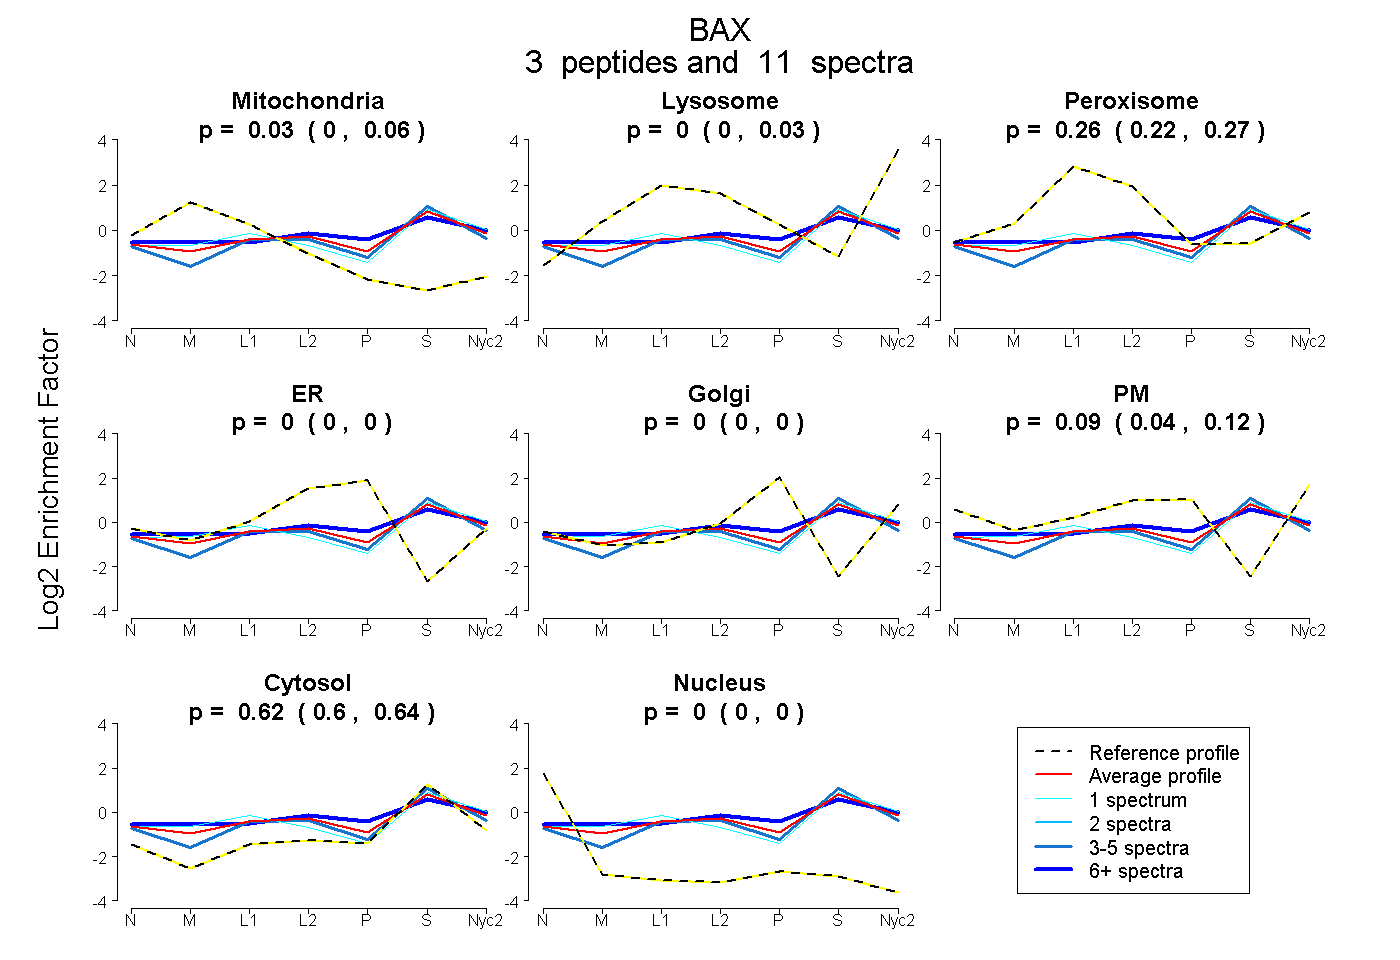 |
0.033
0.004 | 0.064 |
0.000
0.000 | 0.029 |
|
0.255
0.222 | 0.273 |
0.000
0.000 | 0.000 |
0.000
0.000 | 0.000 |
0.089
0.044 | 0.117 |
0.623
0.598 | 0.643 |
0.000
0.000 | 0.000 |
|
| | | Plot |
Mito |
|
Lyso or Perox |
|
ER |
Golgi |
PM |
Cytosol |
Nucleus |
|
| Expt B |
1
peptide |
1
spectrum |
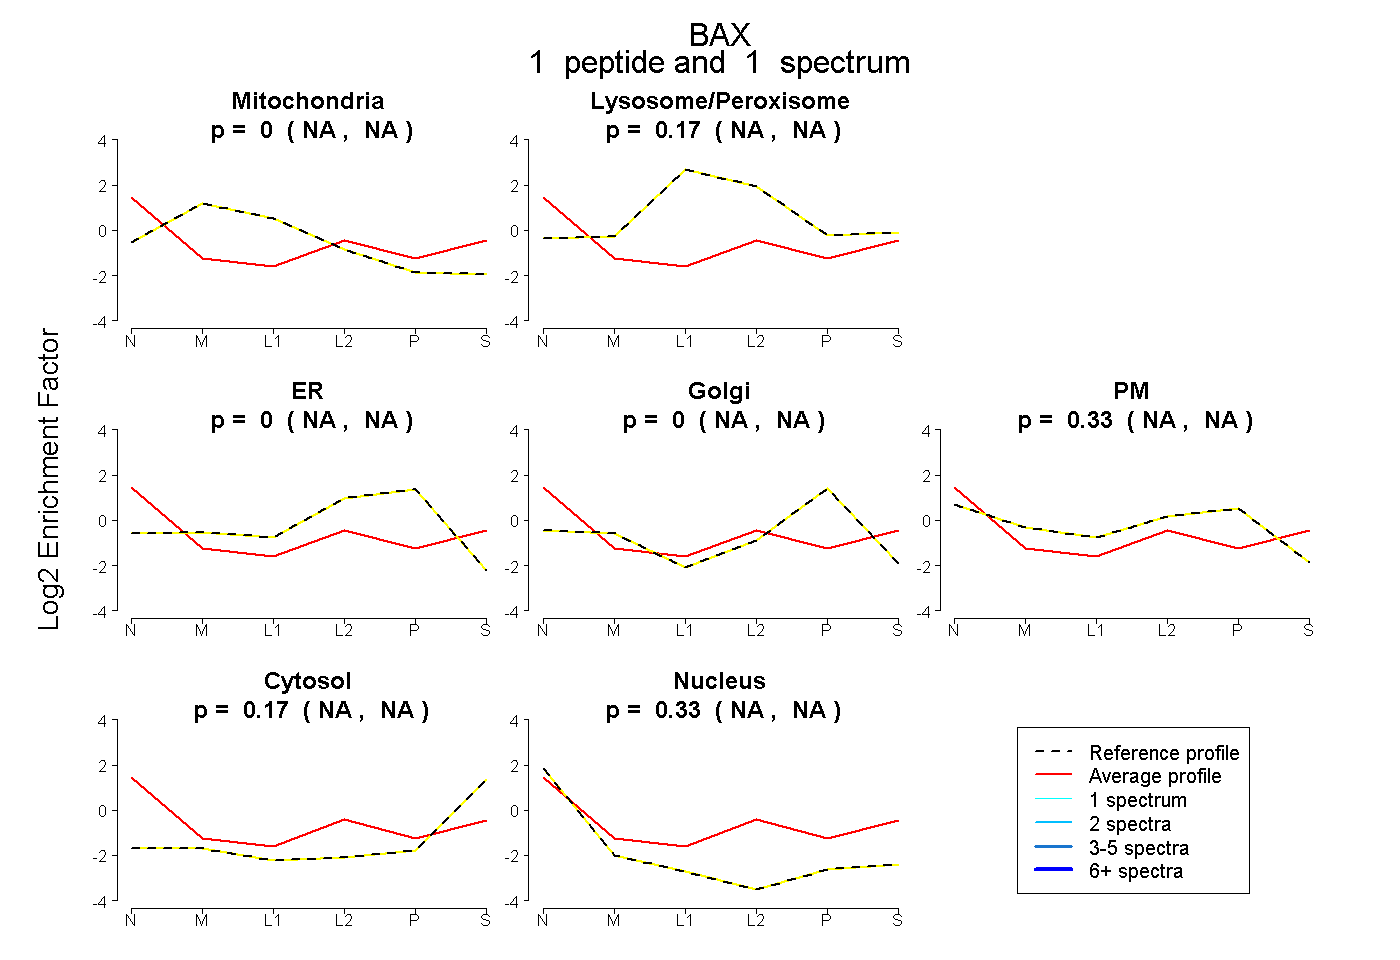 |
0.000
NA | NA |
|
0.166
NA | NA |
|
0.000
NA | NA |
0.000
NA | NA |
0.332
NA | NA |
0.171
NA | NA |
0.331
NA | NA |
|
| | | Plot |
|
Lyso |
|
|
|
|
|
|
|
Other |
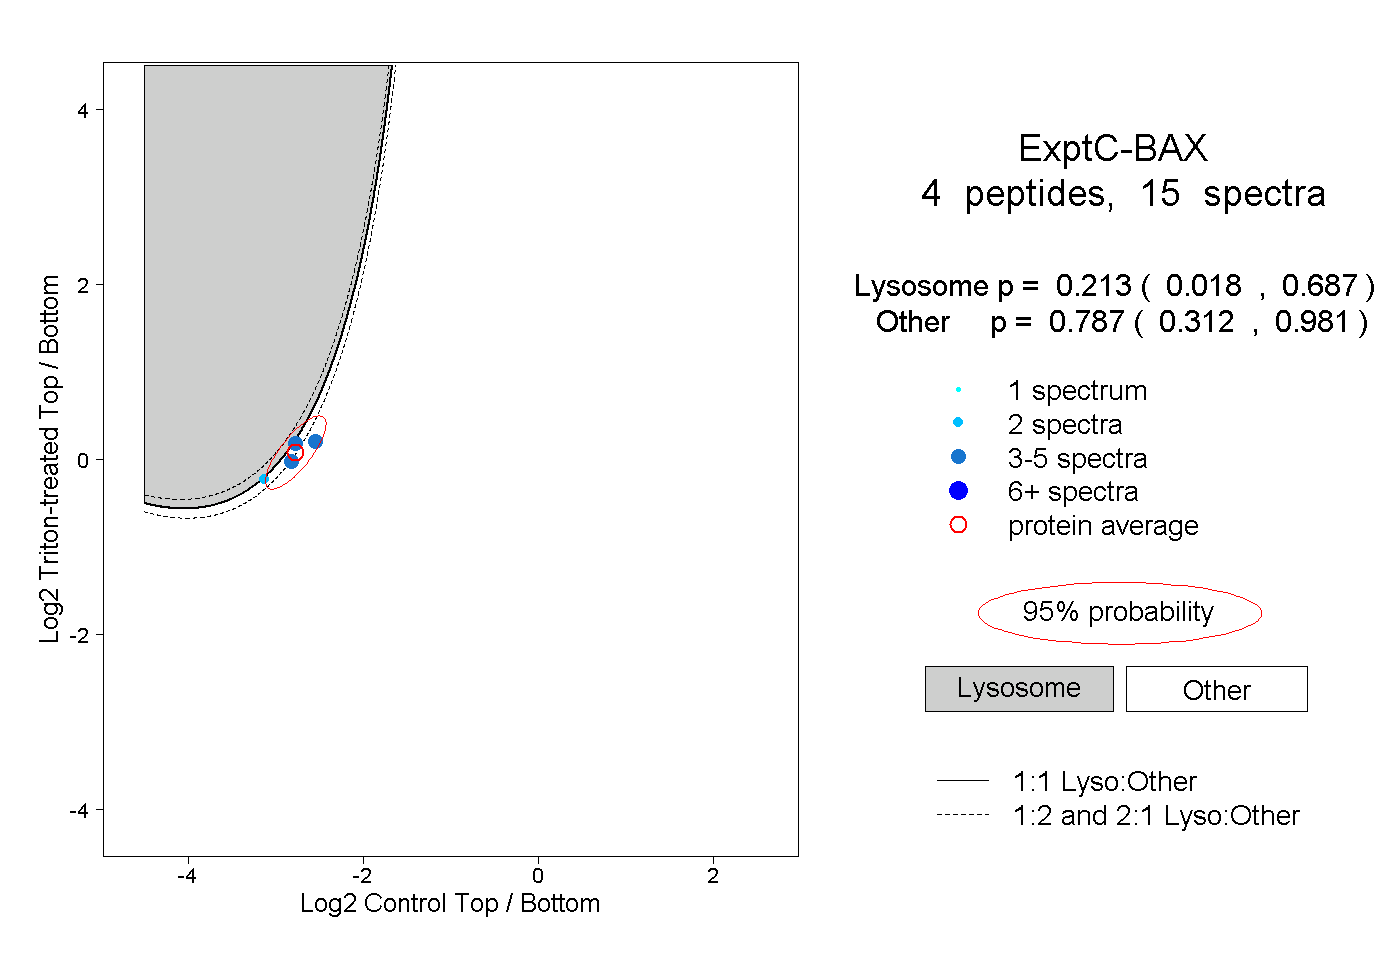
| Expt C |
4
peptides |
15
spectra |
 |
|
0.213
0.018 | 0.687 |
|
|
|
|
|
|
|
0.787
0.312 | 0.981 |
| 2 spectra, LSECLR |
|
0.441 |
|
|
|
|
|
|
|
0.559 |
| 4 spectra, IGDELDNNMELQR |
|
0.031 |
|
|
|
|
|
|
|
0.969 |
| 4 spectra, VPELIR |
|
0.174 |
|
|
|
|
|
|
|
0.826 |
| 5 spectra, MIADVDTDSPR |
|
0.390 |
|
|
|
|
|
|
|
0.610 |
| | | Plot |
|
Lyso |
|
|
|
|
|
|
|
Other |
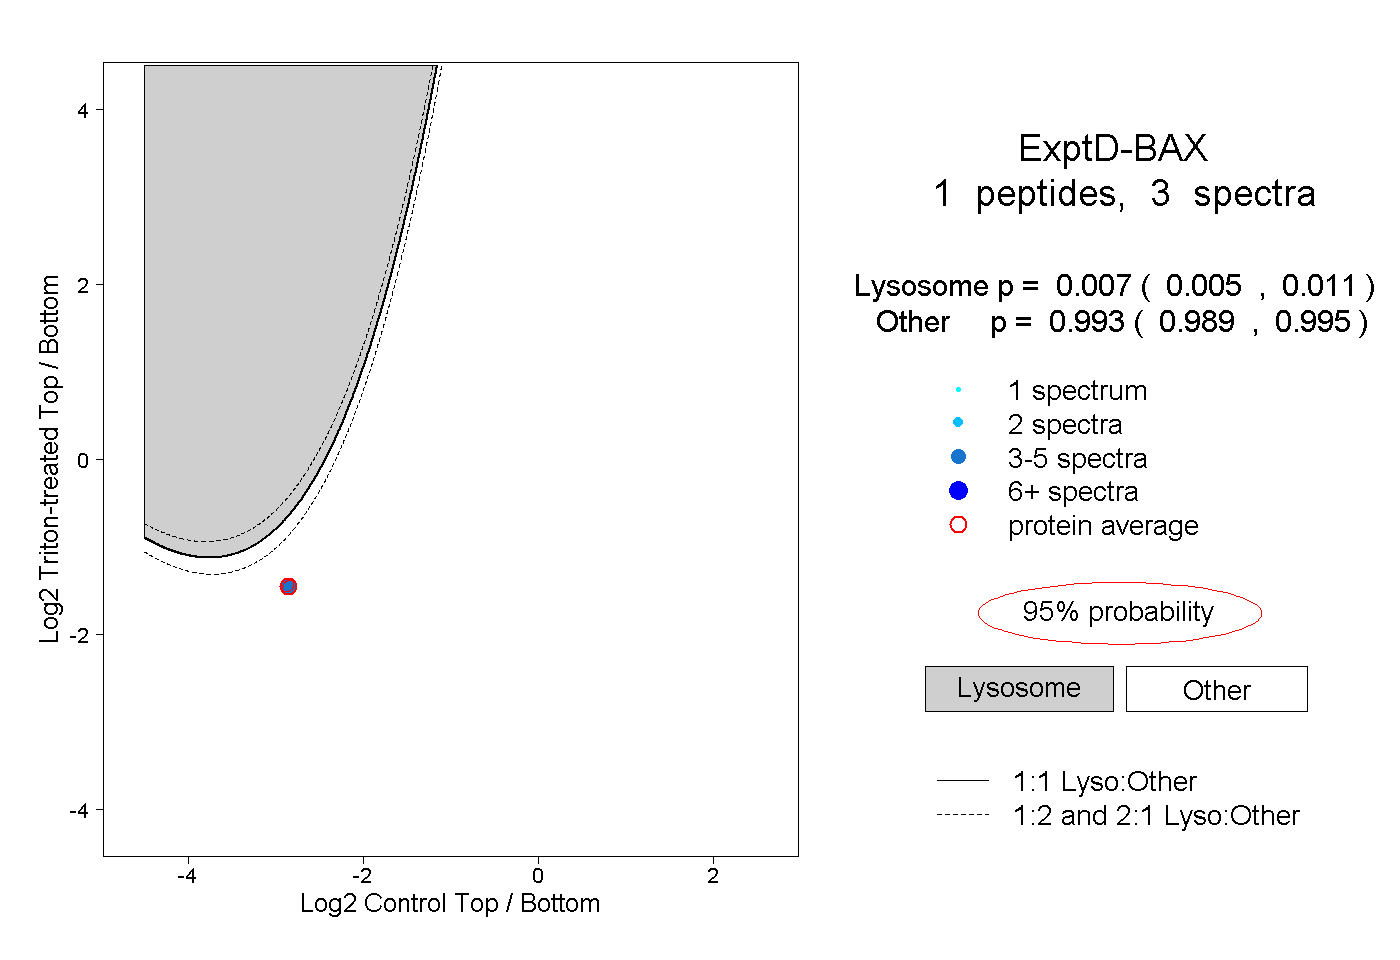
| Expt D |
1
peptide |
3
spectra |
 |
|
0.007
0.005 | 0.011 |
|
|
|
|
|
|
|
0.993
0.989 | 0.995 |