 3
3peptides
spectra
0.004 | 0.064
0.000 | 0.029
0.222 | 0.273
0.000 | 0.000
0.000 | 0.000
0.044 | 0.117
0.598 | 0.643
0.000 | 0.000
| Plot | Mito | Lyso | Perox | ER | Golgi | PM | Cytosol | Nucleus | |||||
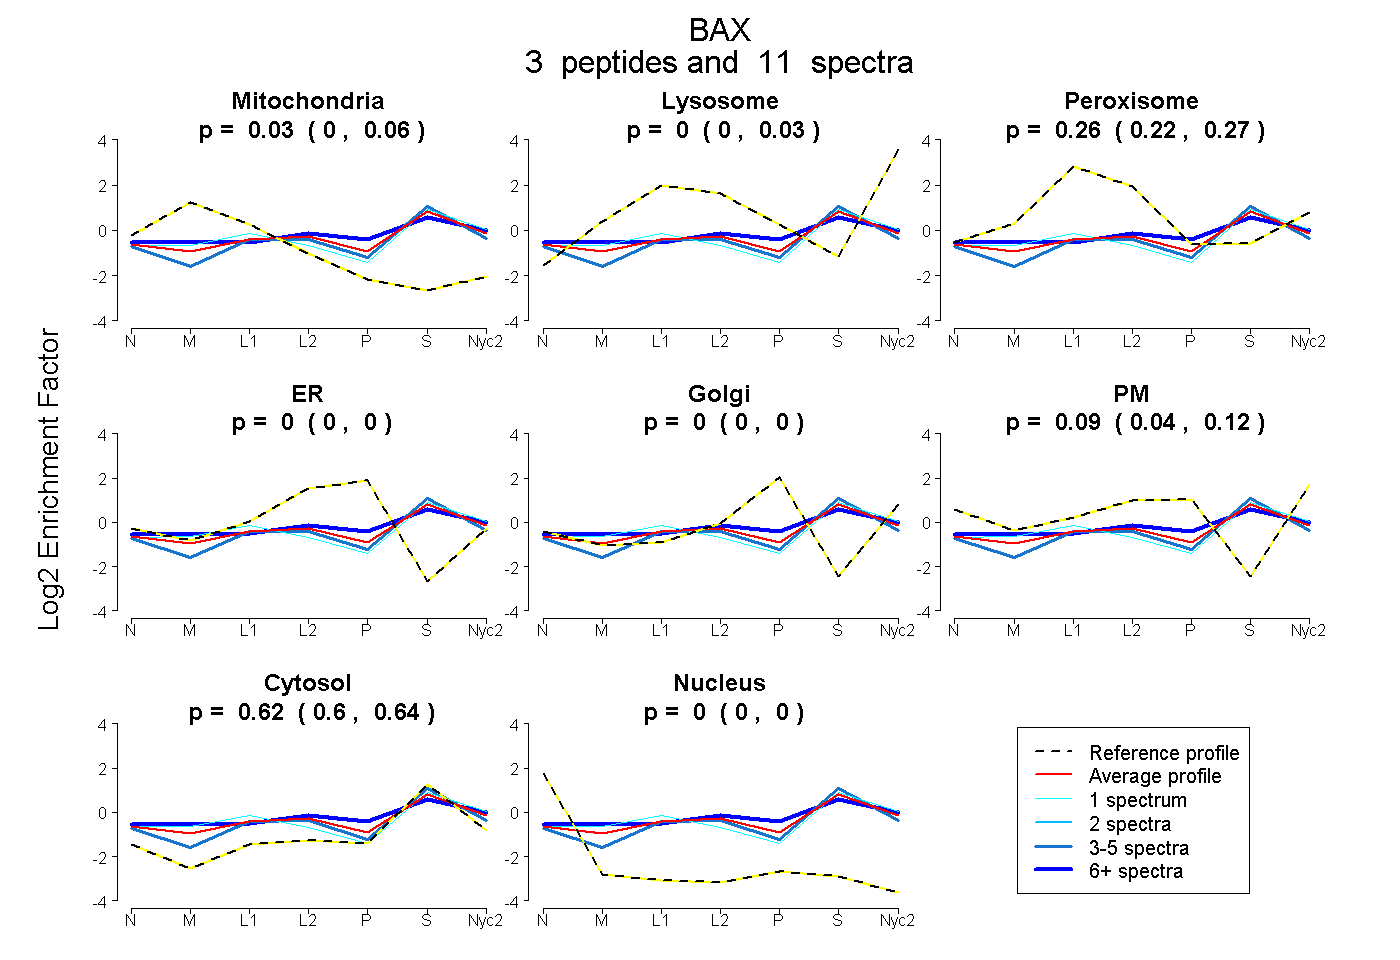
| Expt A |
3 peptides |
11 spectra |
|
0.033 0.004 | 0.064 |
0.000 0.000 | 0.029 |
0.255 0.222 | 0.273 |
0.000 0.000 | 0.000 |
0.000 0.000 | 0.000 |
0.089 0.044 | 0.117 |
0.623 0.598 | 0.643 |
0.000 0.000 | 0.000 |
| 6 spectra, IGDELDNNMELQR | 0.037 | 0.009 | 0.199 | 0.000 | 0.002 | 0.209 | 0.543 | 0.000 | ||
| 1 spectrum, TGAFLLQGFIQDR | 0.112 | 0.086 | 0.204 | 0.000 | 0.000 | 0.000 | 0.598 | 0.000 | ||
| 4 spectra, MIADVDTDSPR | 0.000 | 0.000 | 0.272 | 0.000 | 0.000 | 0.000 | 0.722 | 0.006 |
| Plot | Mito | Lyso or Perox | ER | Golgi | PM | Cytosol | Nucleus | ||||||
| Expt B |
1 peptide |
1 spectrum |
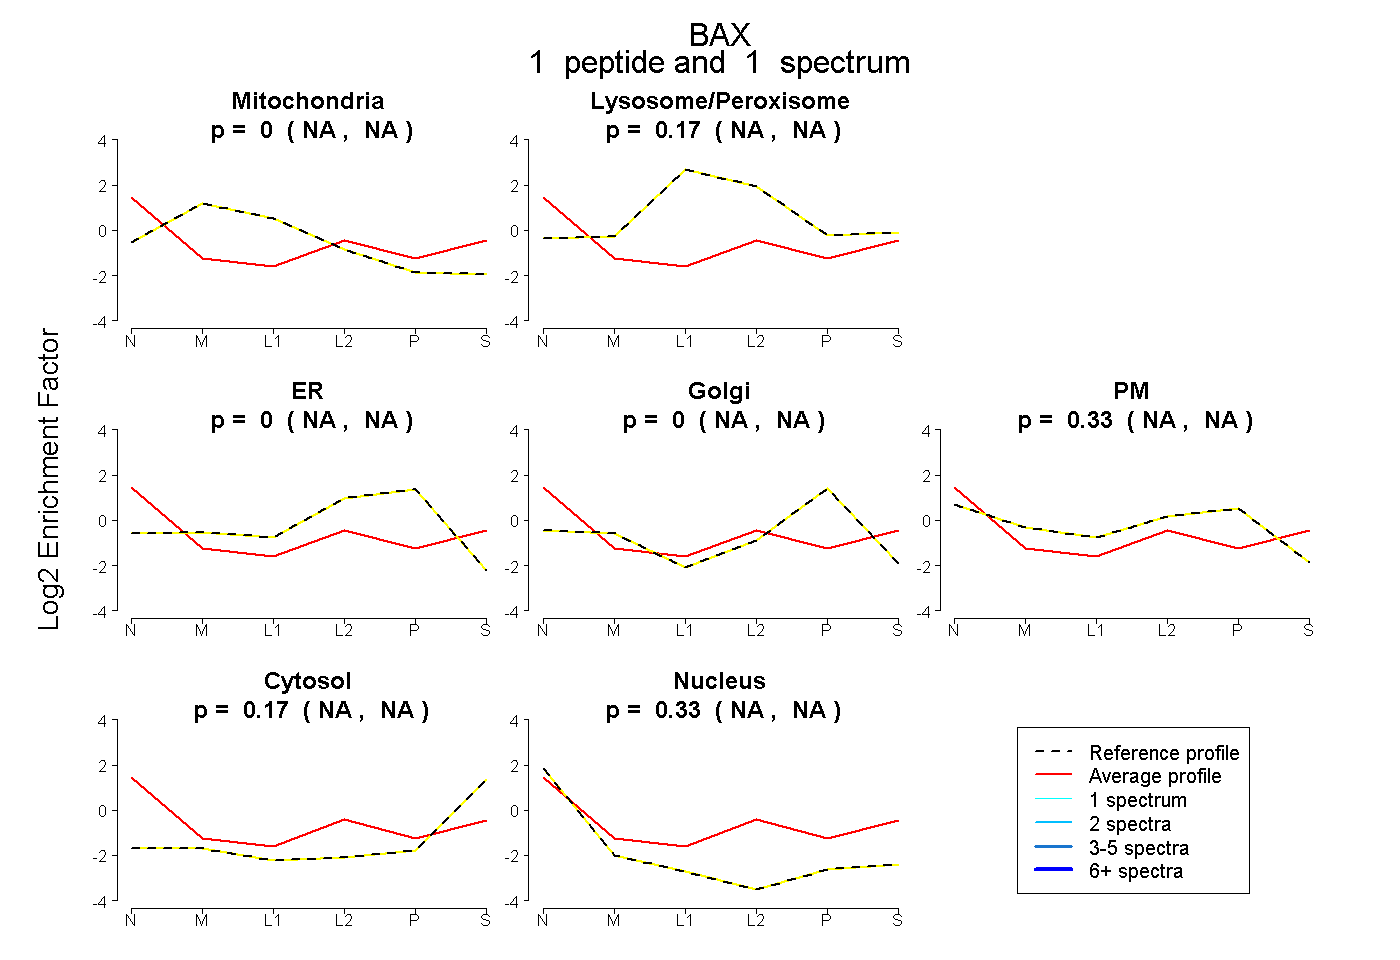 |
0.000 NA | NA |
0.166 NA | NA |
0.000 NA | NA |
0.000 NA | NA |
0.332 NA | NA |
0.171 NA | NA |
0.331 NA | NA |
|||
| Plot | Lyso | Other | |||||||||||
| Expt C |
4 peptides |
15 spectra |
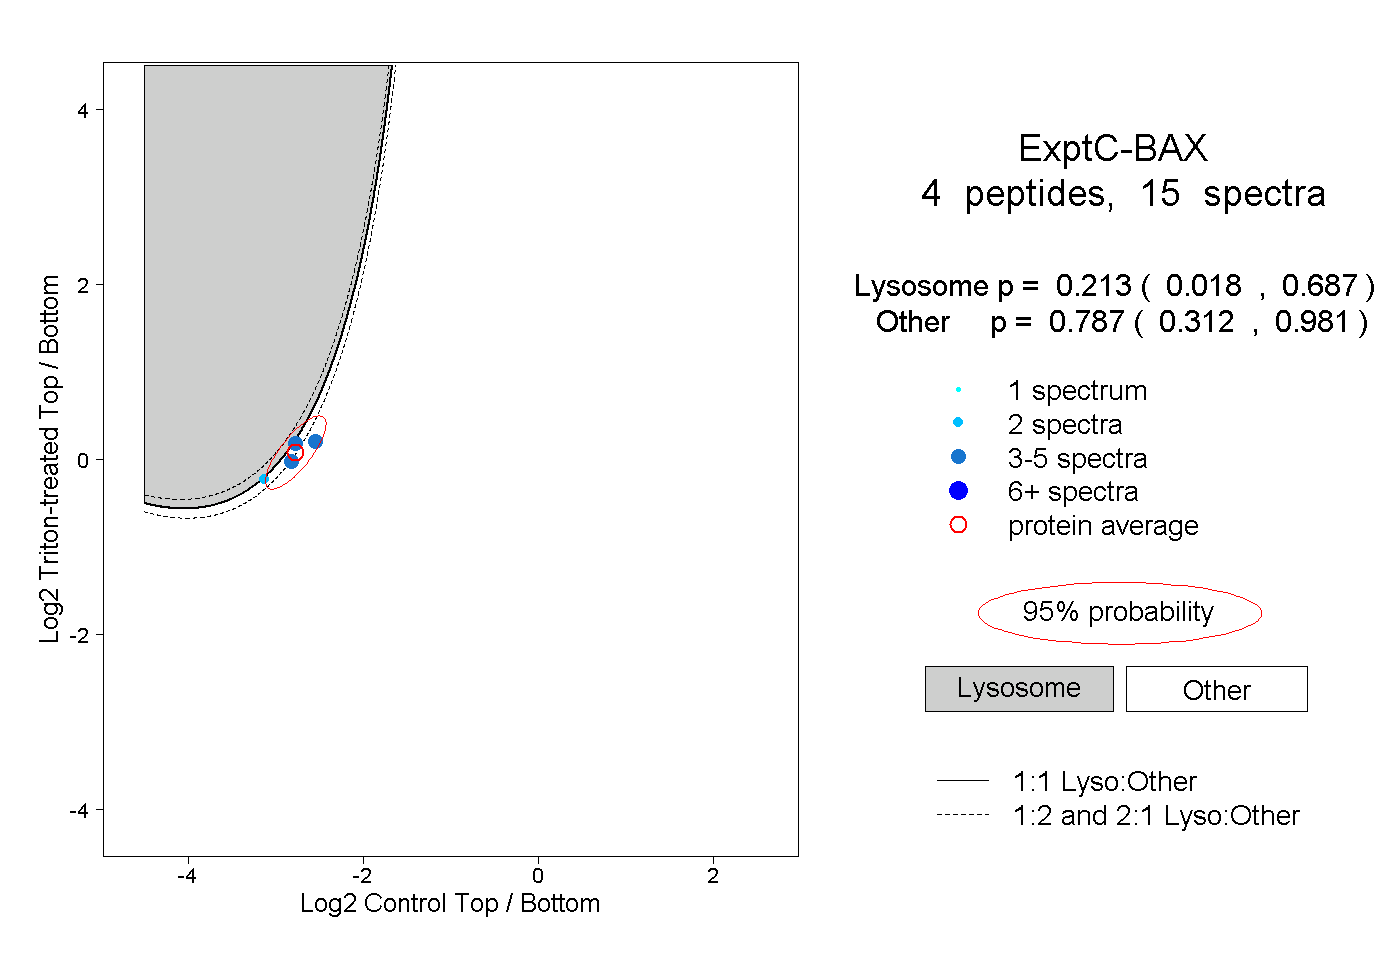 |
0.213 0.018 | 0.687 |
0.787 0.312 | 0.981 |
||||||||
| Plot | Lyso | Other | |||||||||||
| Expt D |
1 peptide |
3 spectra |
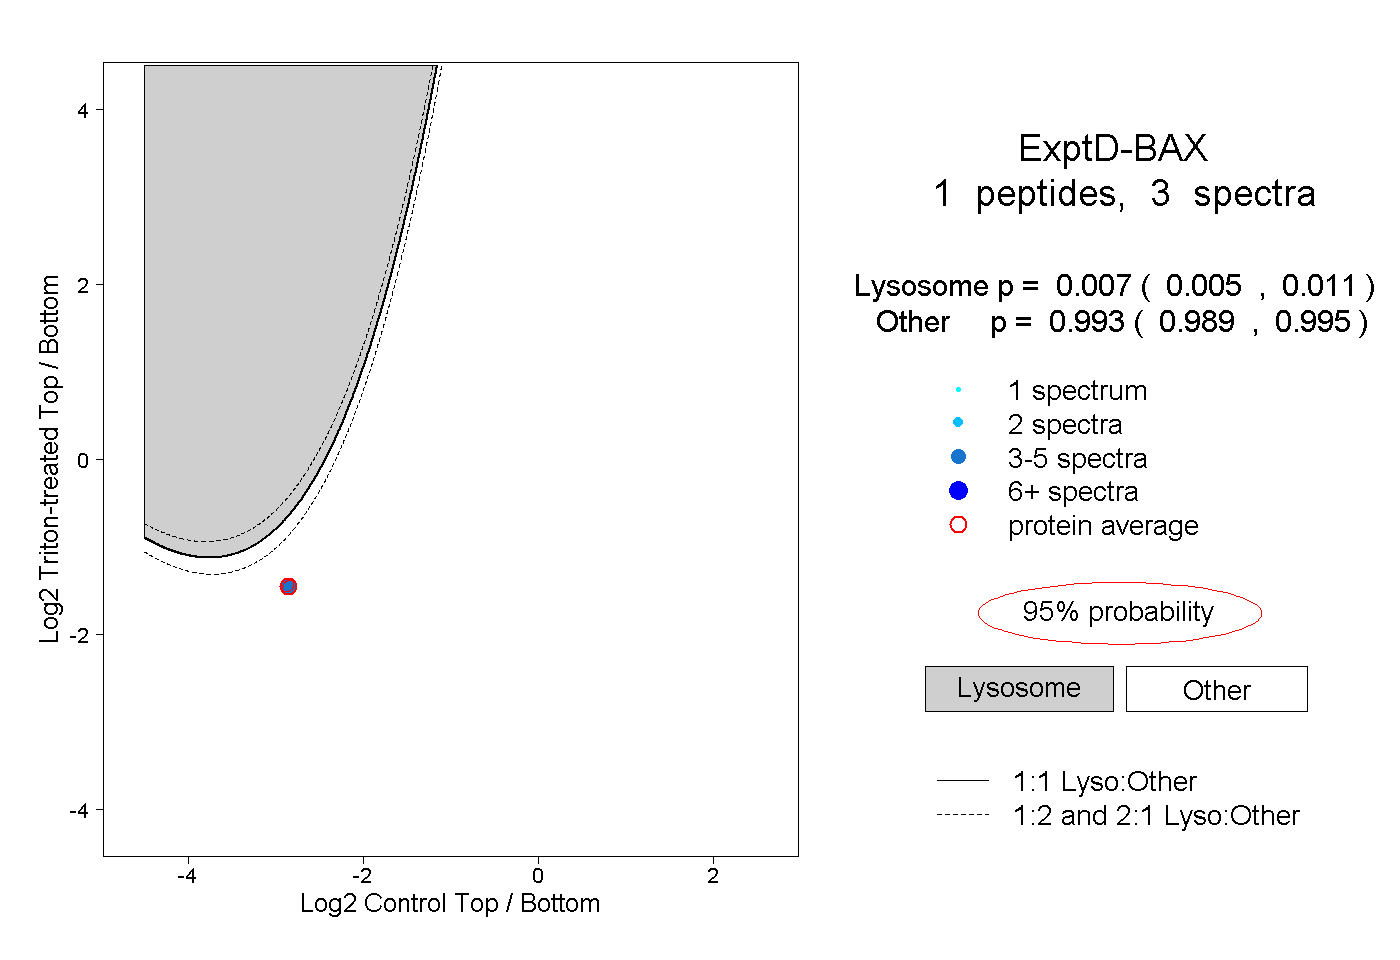 |
0.007 0.005 | 0.011 |
0.993 0.989 | 0.995 |