 3
3peptides
spectra
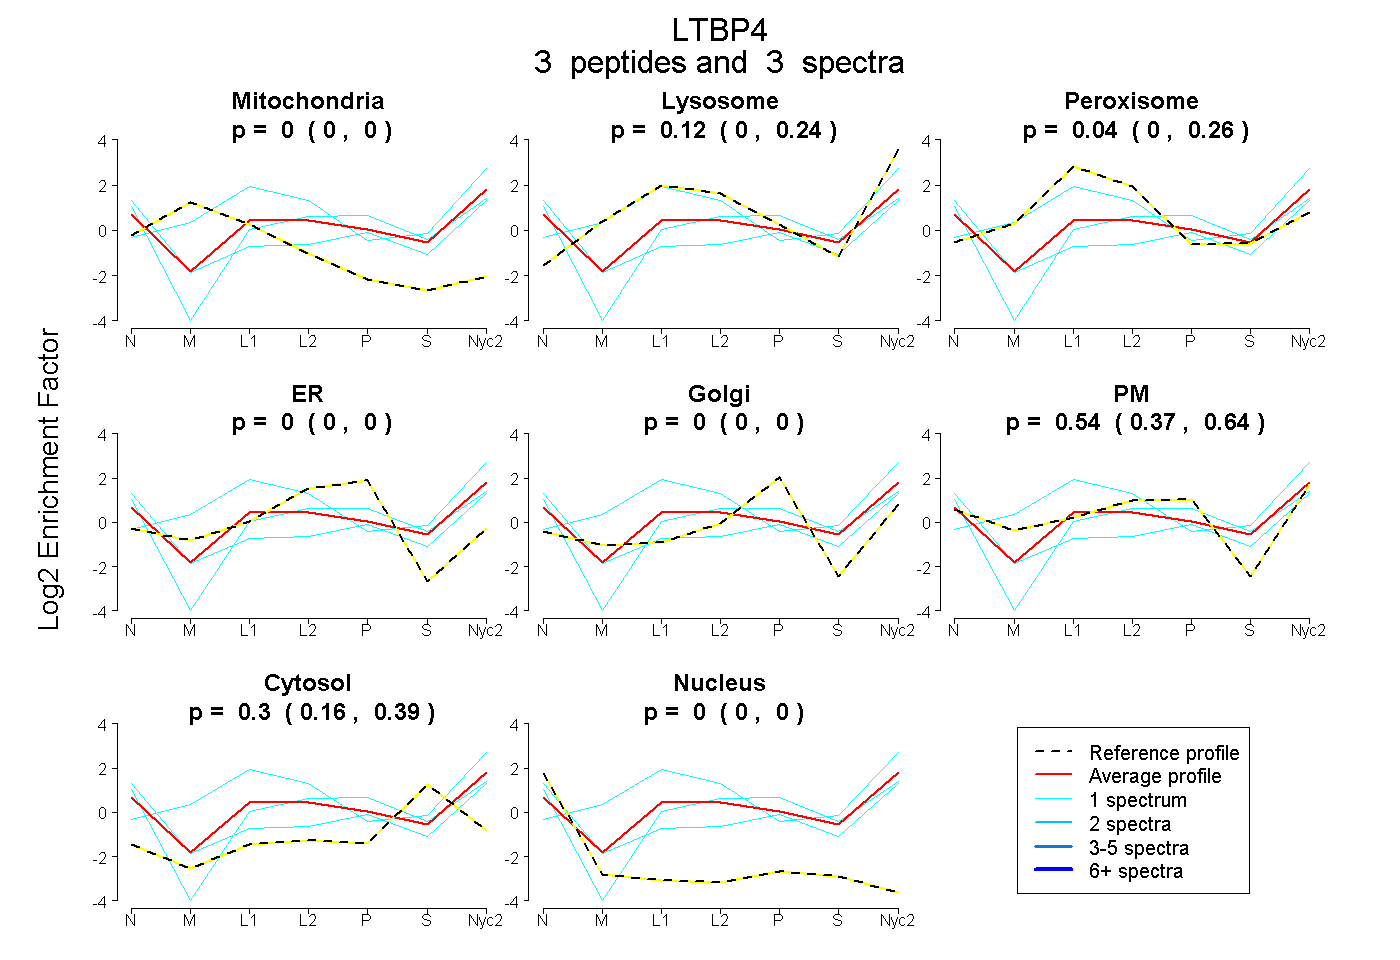
0.000 | 0.000
0.000 | 0.237
0.000 | 0.256
0.000 | 0.000
0.000 | 0.000
0.372 | 0.643
0.159 | 0.385
0.000 | 0.001
5peptides
spectra
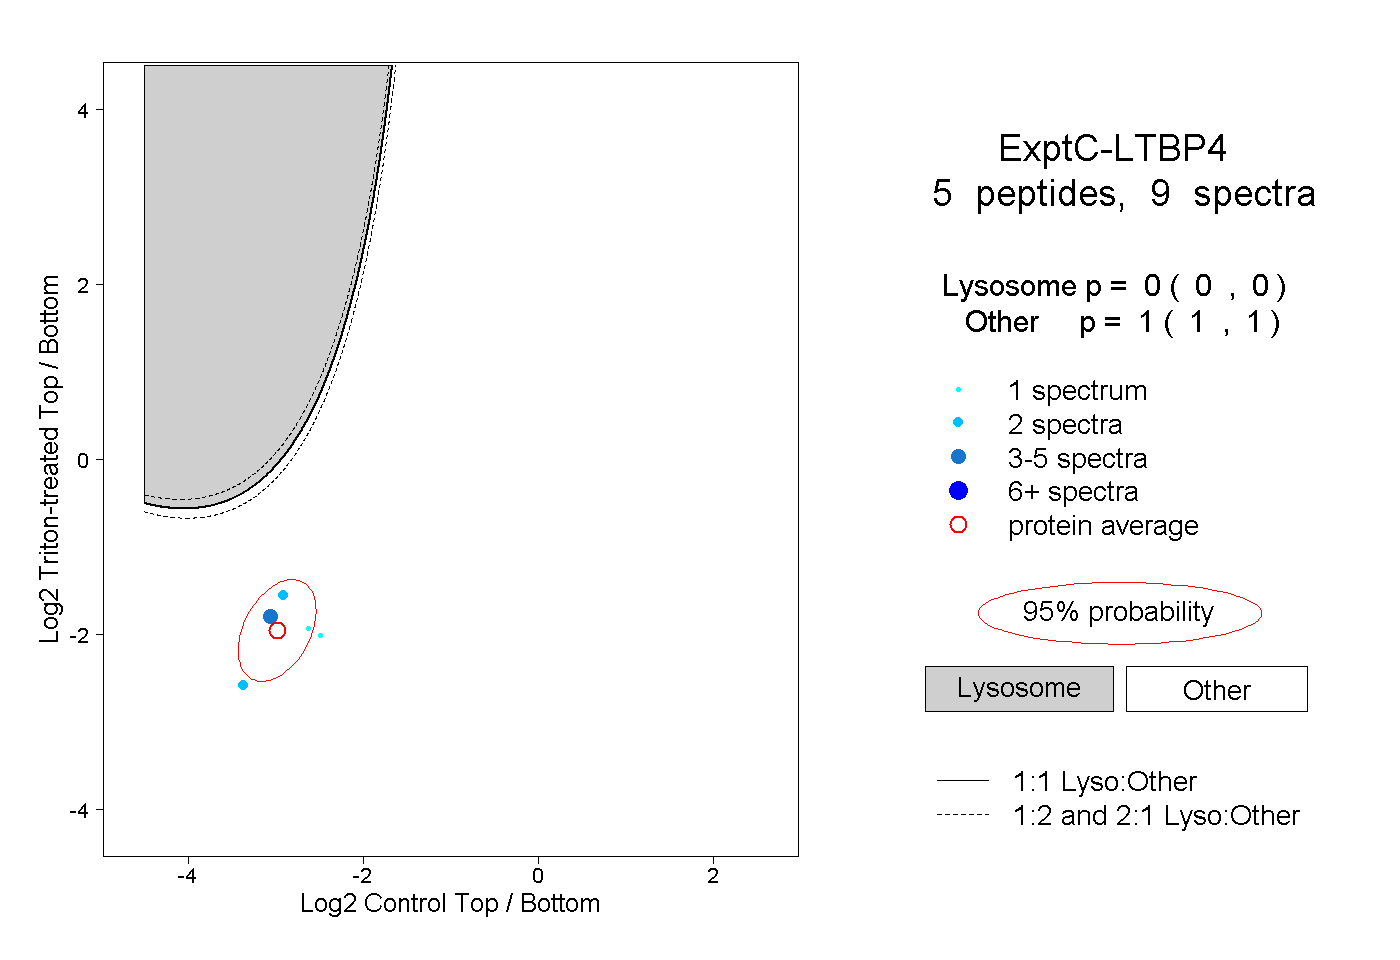
0.000 | 0.000
1.000 | 1.000
1peptide
spectrum
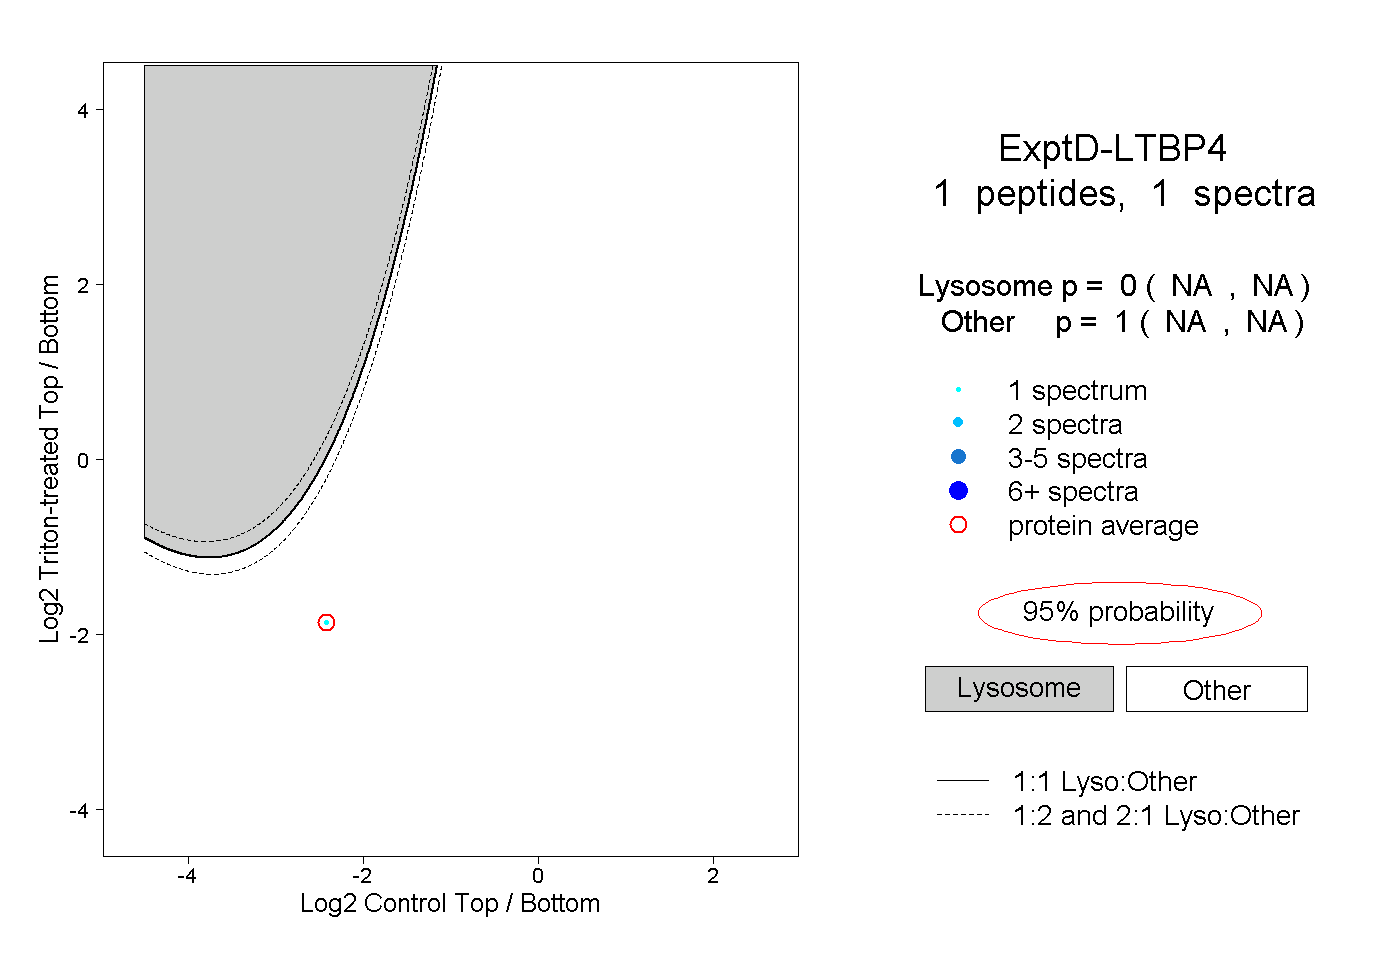
NA | NA
NA | NA