MRPL9
[ENSRNOP00000028316]
Main page
| | | Plot |
Mito |
Lyso |
|
Perox |
ER |
Golgi |
PM |
Cytosol |
Nucleus |
|
| Expt A |
 5
5
peptides |
14
spectra |
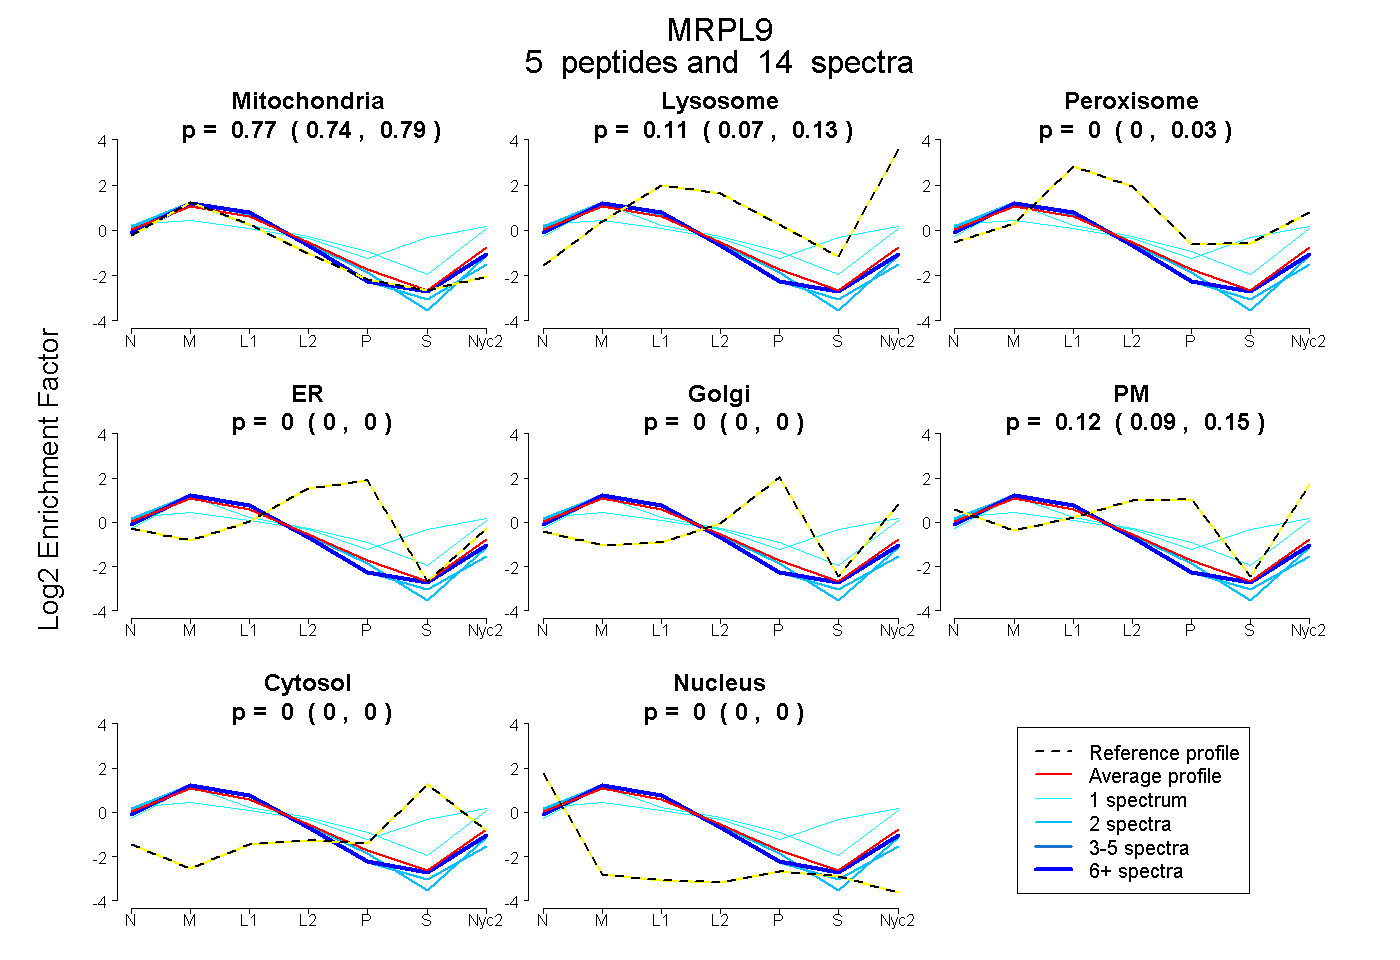 |
0.768
0.743 | 0.785 |
0.108
0.069 | 0.132 |
|
0.000
0.000 | 0.028 |
0.000
0.000 | 0.000 |
0.000
0.000 | 0.000 |
0.124
0.093 | 0.154 |
0.000
0.000 | 0.000 |
0.000
0.000 | 0.000 |
|
| | | Plot |
Mito |
|
Lyso or Perox |
|
ER |
Golgi |
PM |
Cytosol |
Nucleus |
|
| Expt B |
4
peptides |
9
spectra |
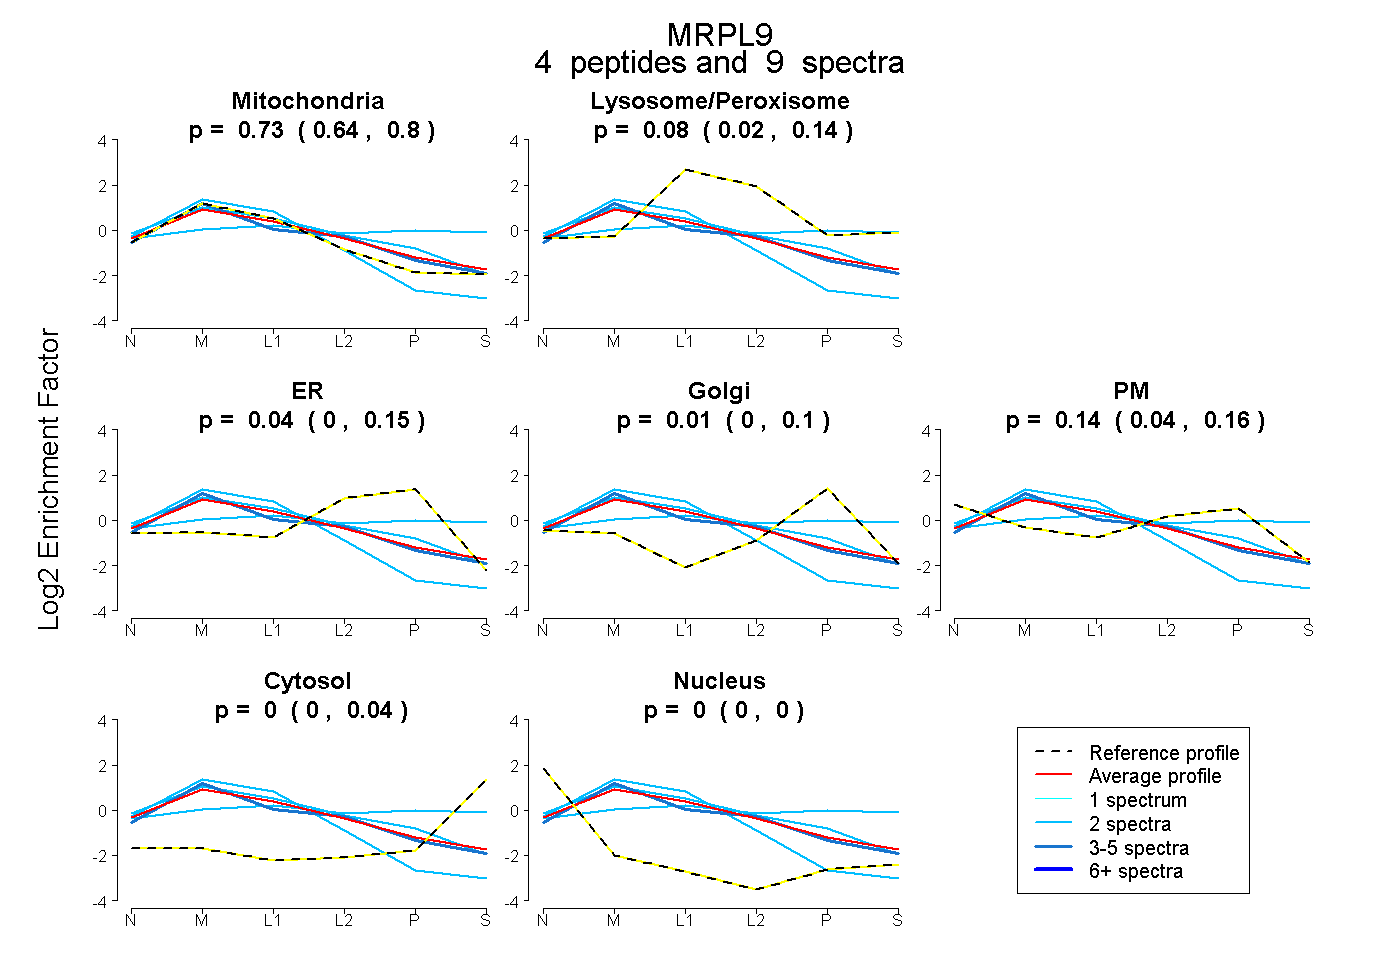 |
0.732
0.637 | 0.798 |
|
0.075
0.016 | 0.143 |
|
0.042
0.000 | 0.149 |
0.011
0.000 | 0.101 |
0.139
0.045 | 0.160 |
0.000
0.000 | 0.040 |
0.000
0.000 | 0.005 |
|
| 3 spectra, VPMSVVLFR |
0.816 |
|
0.000 |
|
0.184 |
0.000 |
0.000 |
0.000 |
0.000 |
|
| 2 spectra, NLGVVVAPHALR |
0.112 |
|
0.406 |
|
0.000 |
0.242 |
0.046 |
0.195 |
0.000 |
|
| 2 spectra, LPEDPITR |
0.991 |
|
0.000 |
|
0.000 |
0.000 |
0.000 |
0.000 |
0.009 |
|
| 2 spectra, VPLAGEGR |
0.652 |
|
0.081 |
|
0.083 |
0.000 |
0.184 |
0.000 |
0.000 |
|
| | | Plot |
|
Lyso |
|
|
|
|
|
|
|
Other |
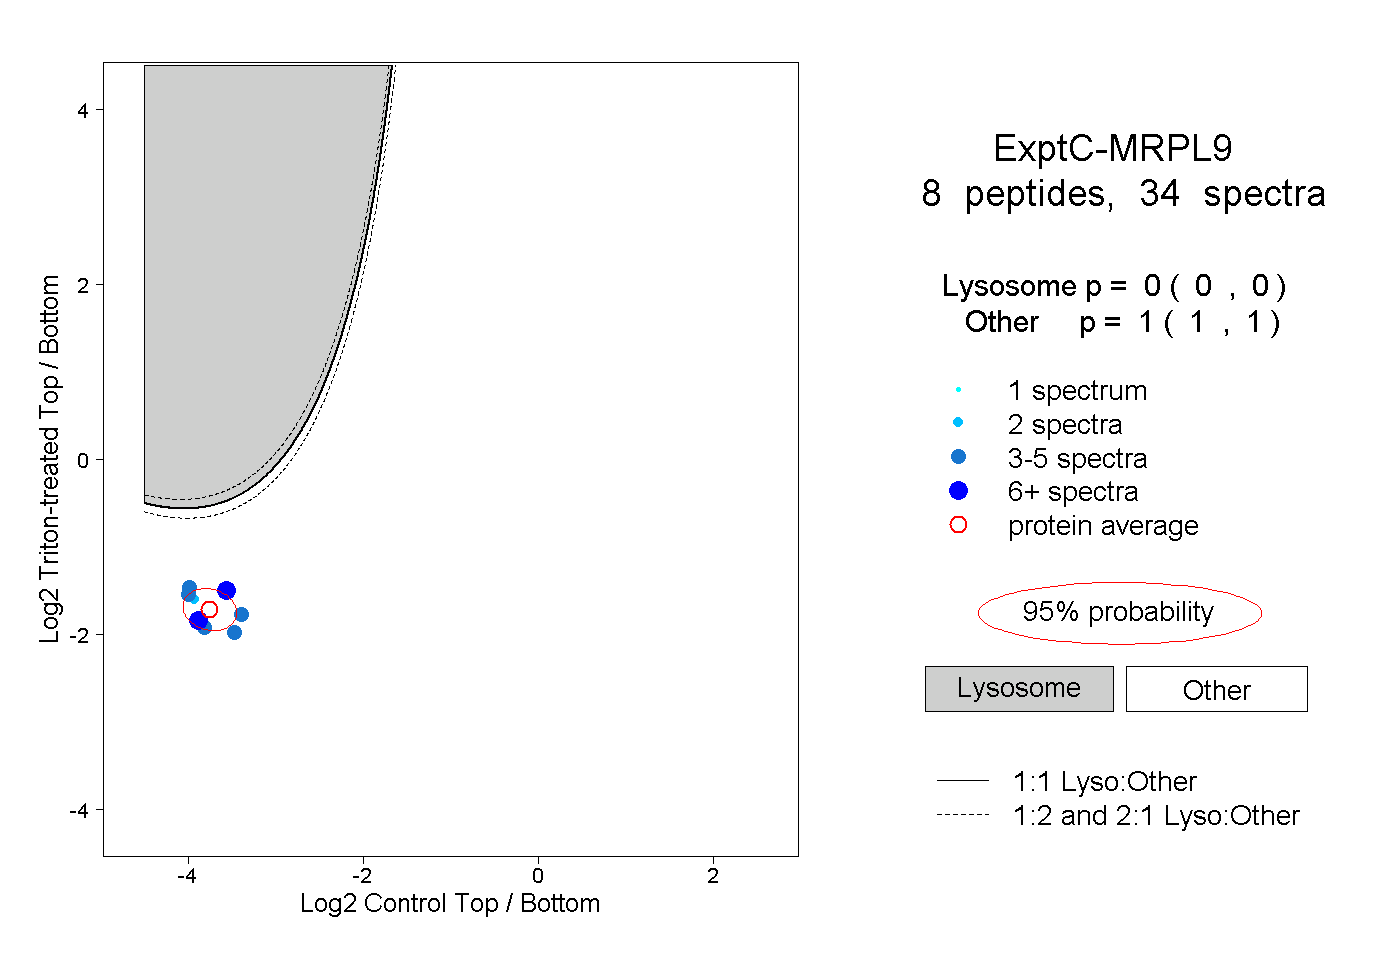
| Expt C |
8
peptides |
34
spectra |
 |
|
0.000
0.000 | 0.000 |
|
|
|
|
|
|
|
1.000
1.000 | 1.000 |
| | | Plot |
|
Lyso |
|
|
|
|
|
|
|
Other |
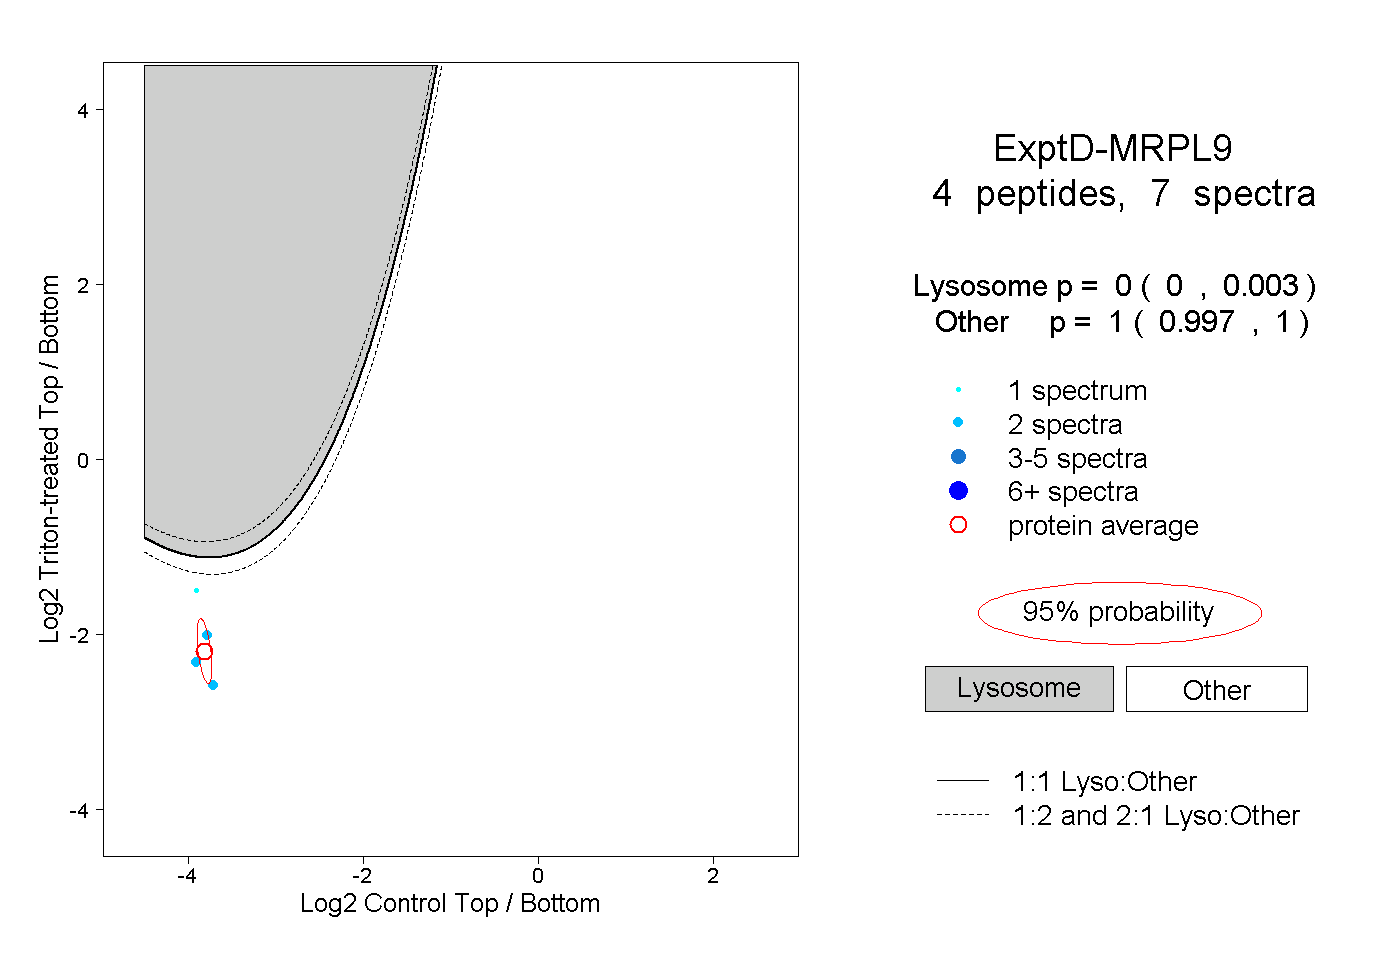
| Expt D |
4
peptides |
7
spectra |
 |
|
0.000
0.000 | 0.003 |
|
|
|
|
|
|
|
1.000
0.997 | 1.000 |