 6
6peptides
spectra
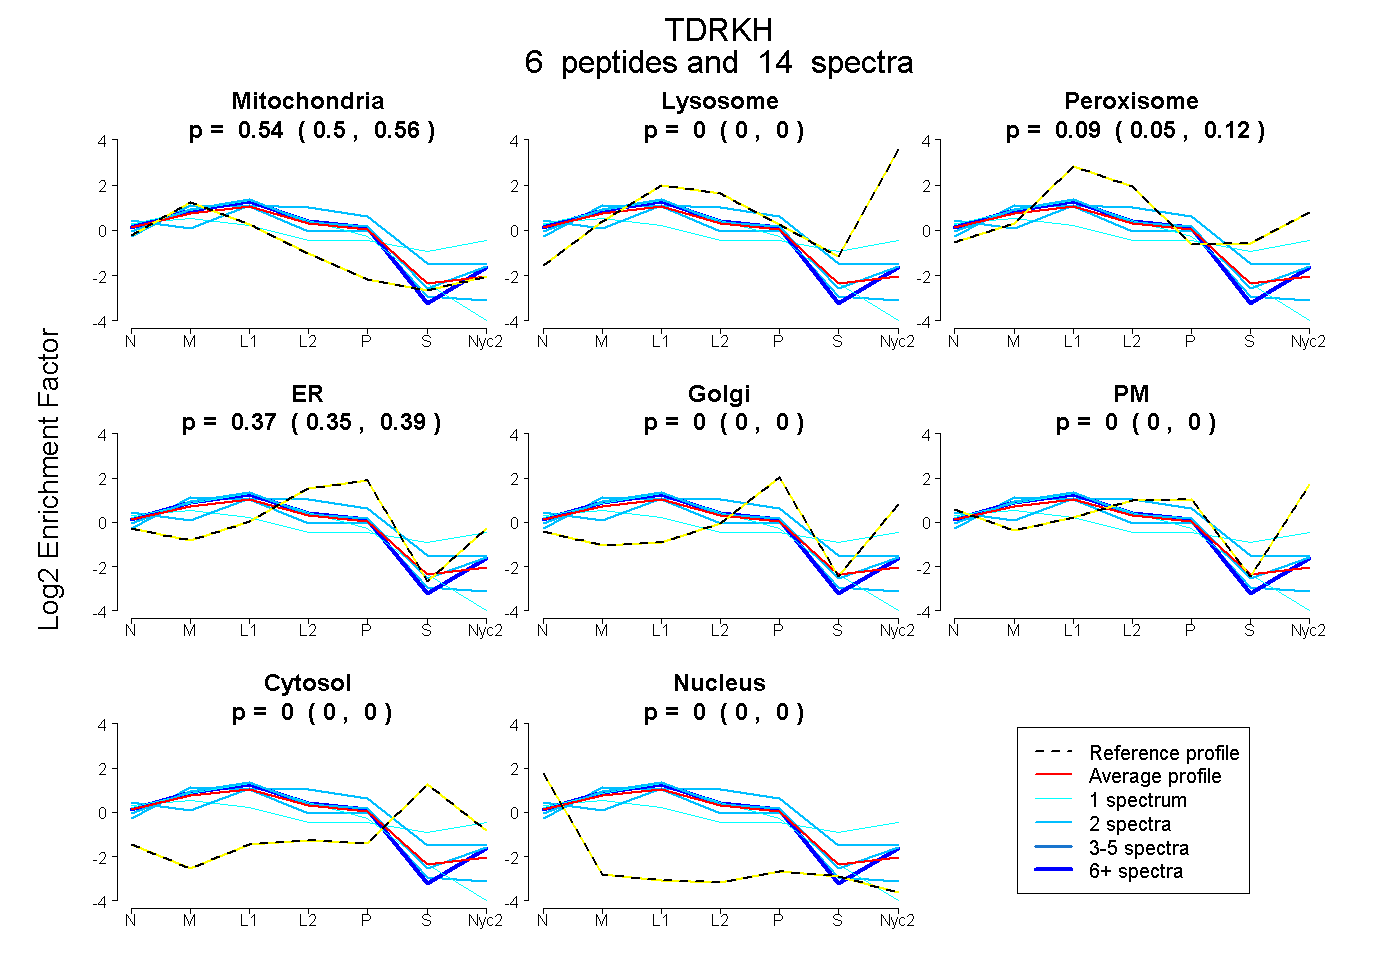
0.504 | 0.559
0.000 | 0.000
0.053 | 0.122
0.351 | 0.393
0.000 | 0.000
0.000 | 0.000
0.000 | 0.000
0.000 | 0.000
2peptides
spectra
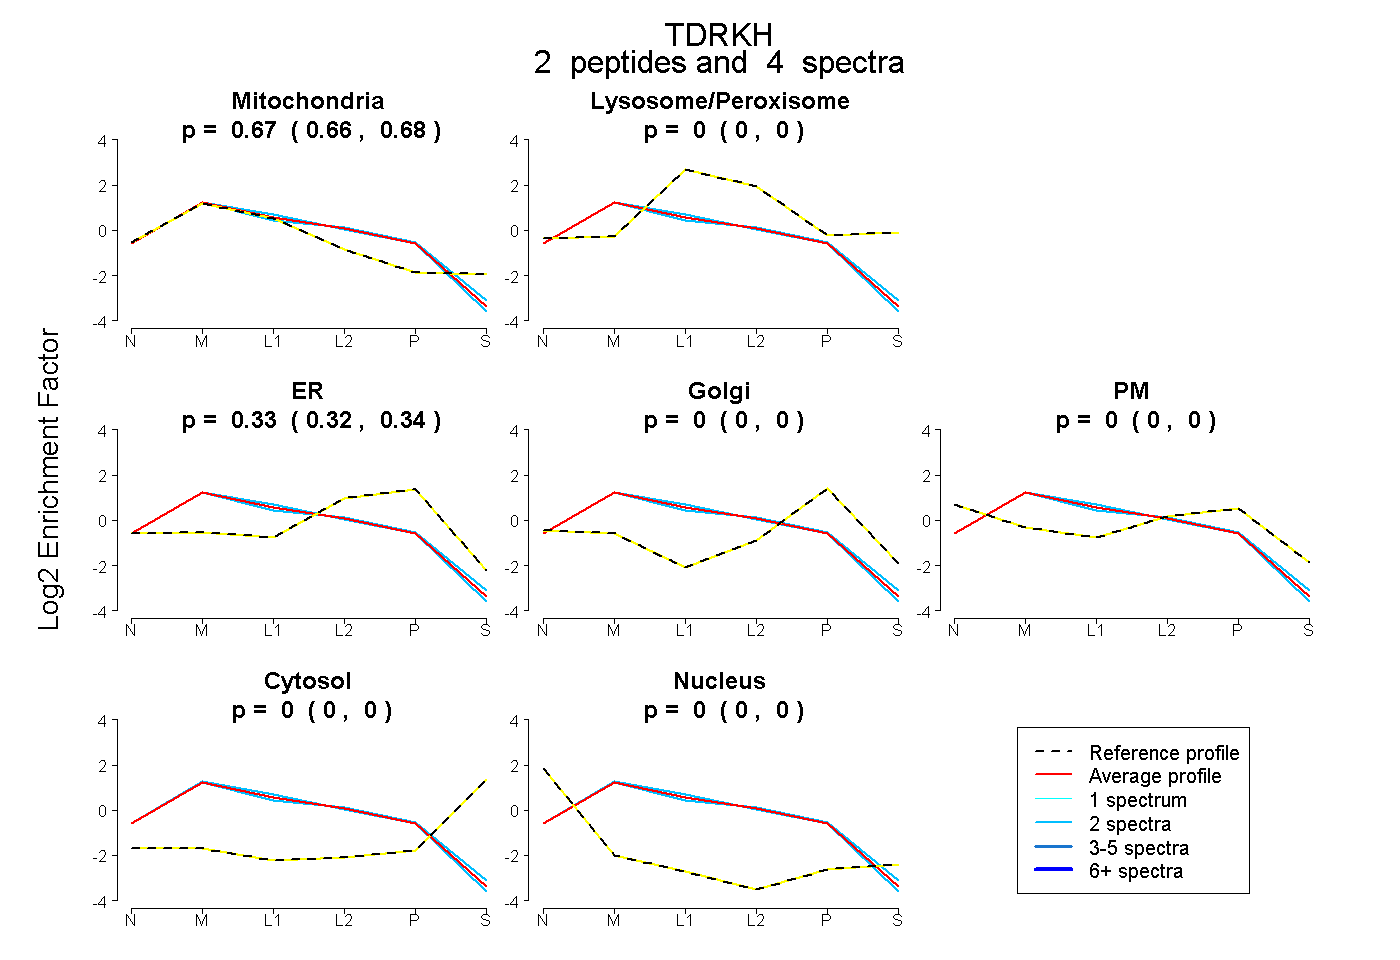
0.659 | 0.676
0.000 | 0.000
0.322 | 0.339
0.000 | 0.000
0.000 | 0.000
0.000 | 0.000
0.000 | 0.000
7peptides
spectra
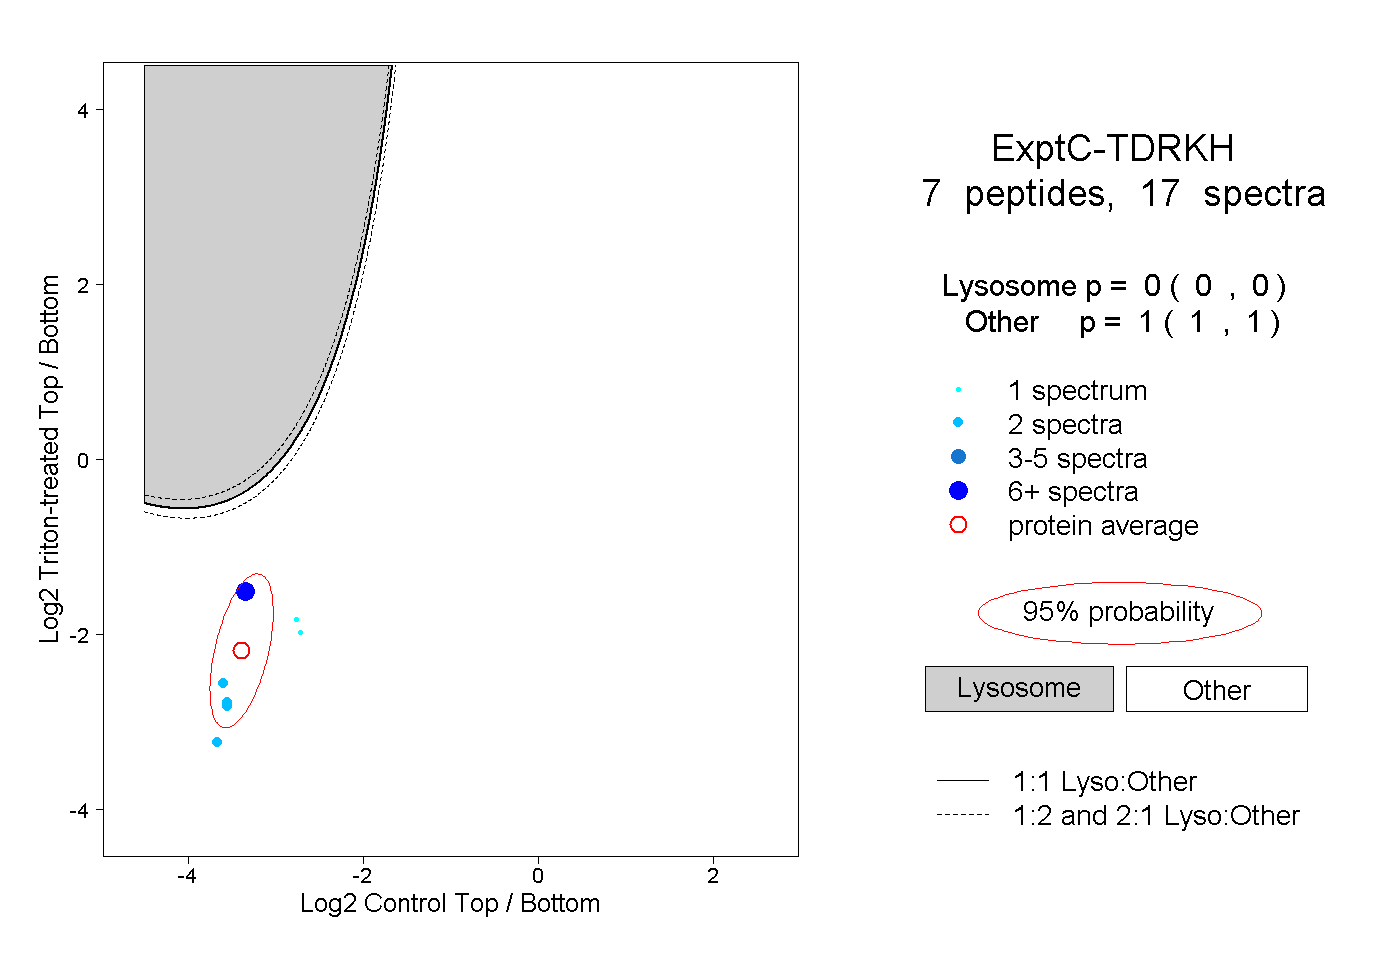
0.000 | 0.000
1.000 | 1.000
1peptide
spectra
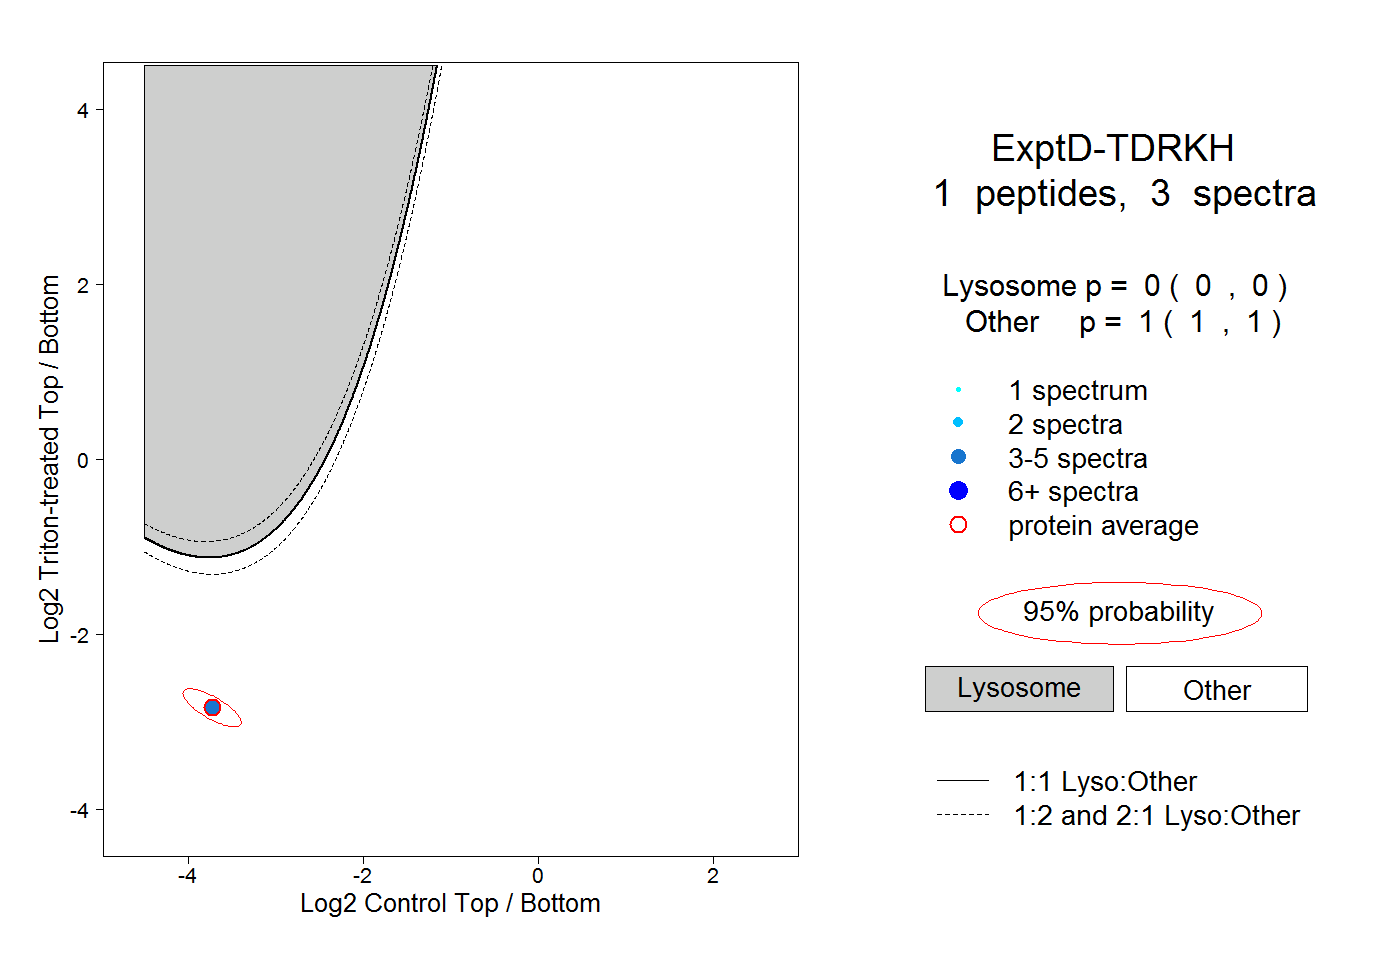
0.000 | 0.000
1.000 | 1.000