 3
3peptides
spectra
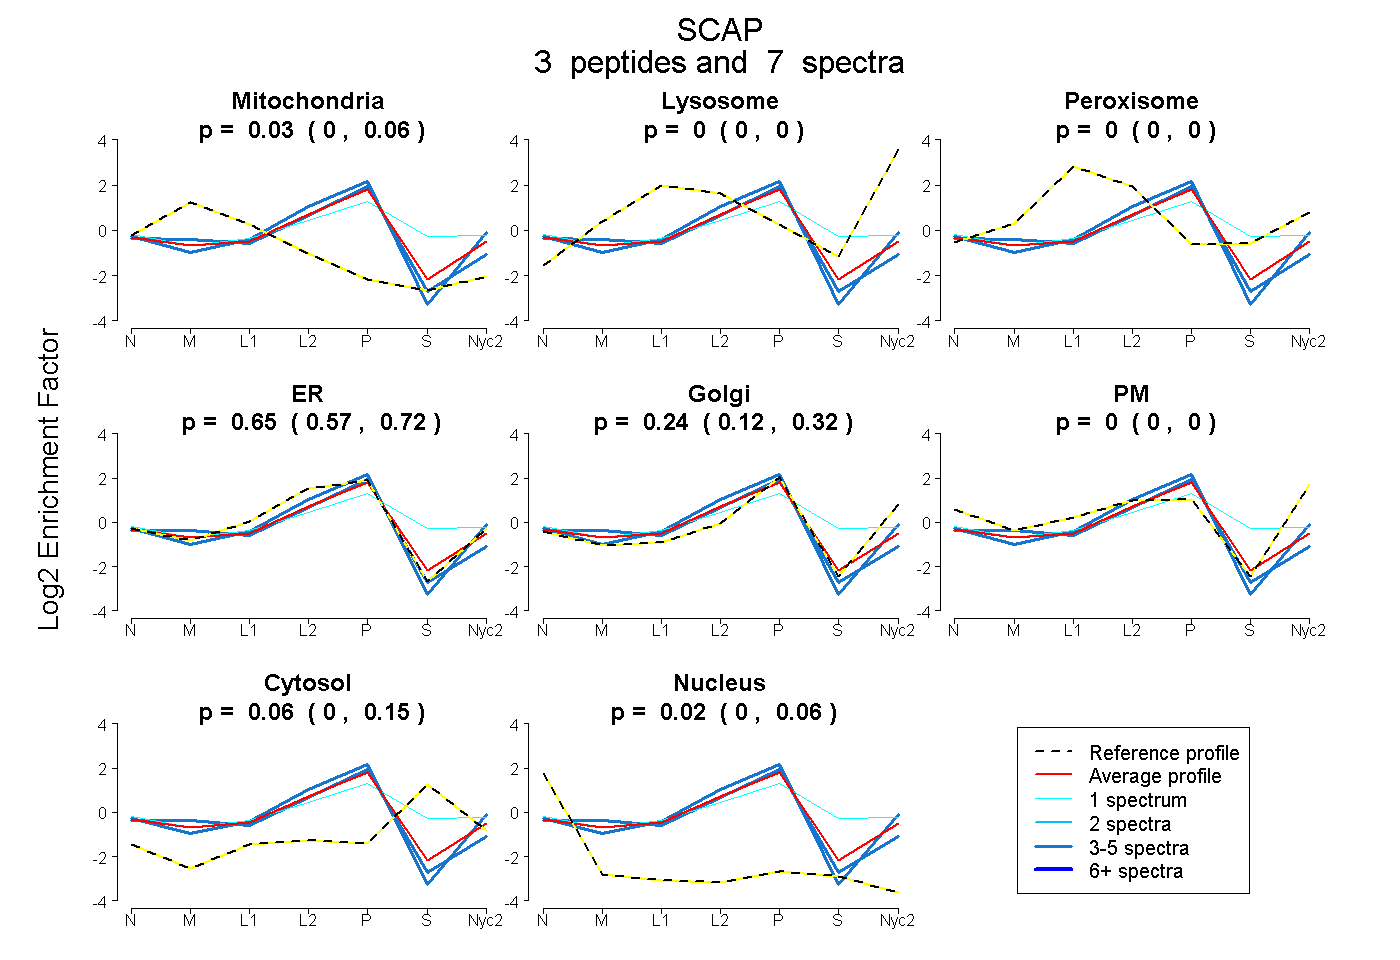
0.000 | 0.063
0.000 | 0.000
0.000 | 0.000
0.570 | 0.722
0.120 | 0.319
0.000 | 0.000
0.000 | 0.146
0.000 | 0.060
1peptide
spectrum
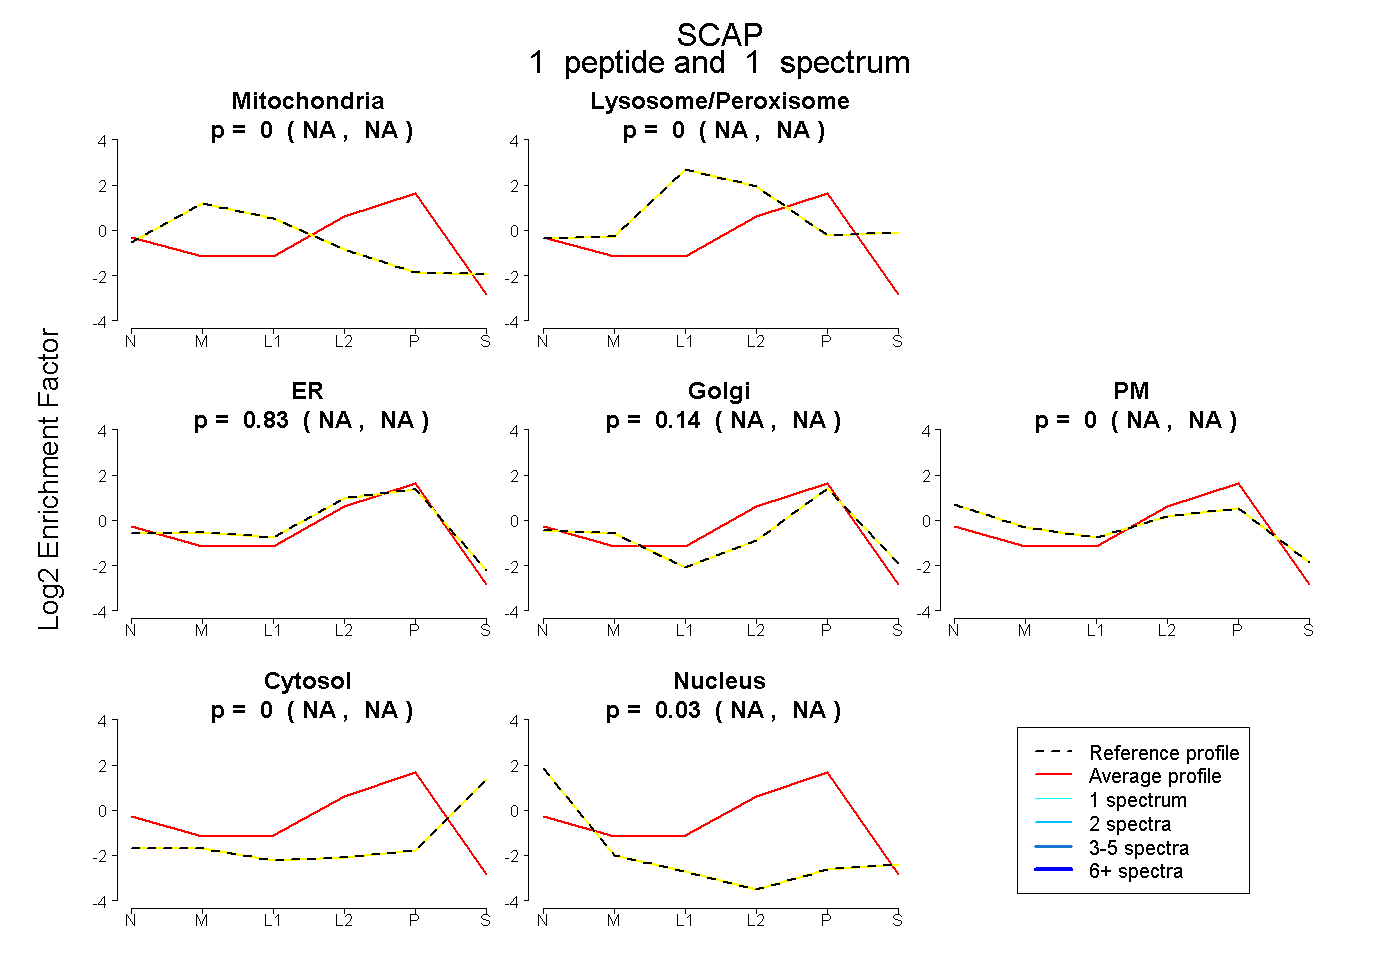
NA | NA
NA | NA
NA | NA
NA | NA
NA | NA
NA | NA
NA | NA
2peptides
spectra
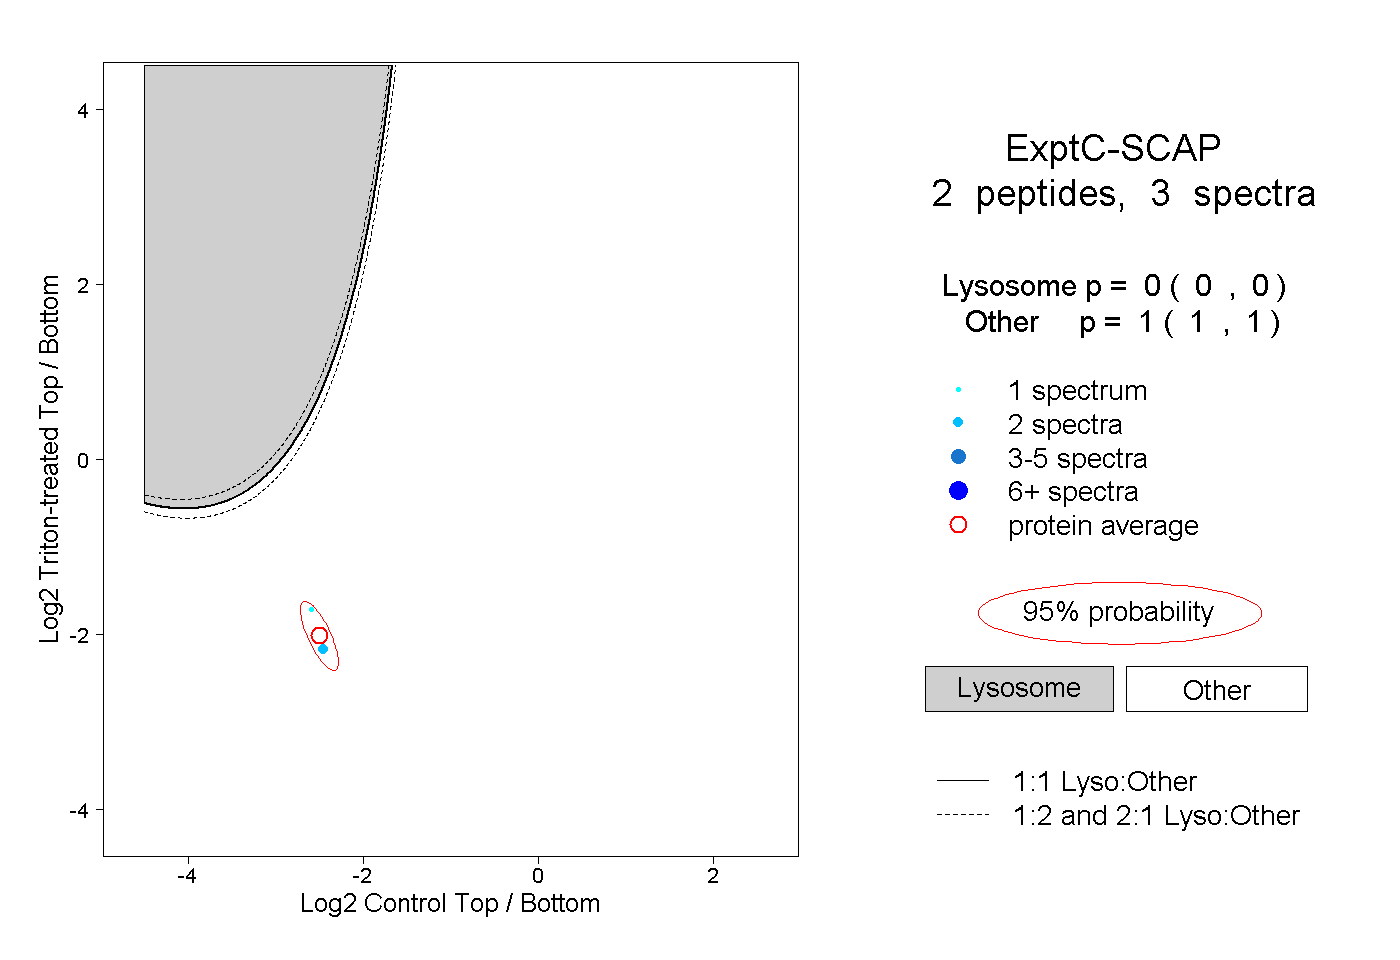
0.000 | 0.000
1.000 | 1.000