 2
2peptides
spectra
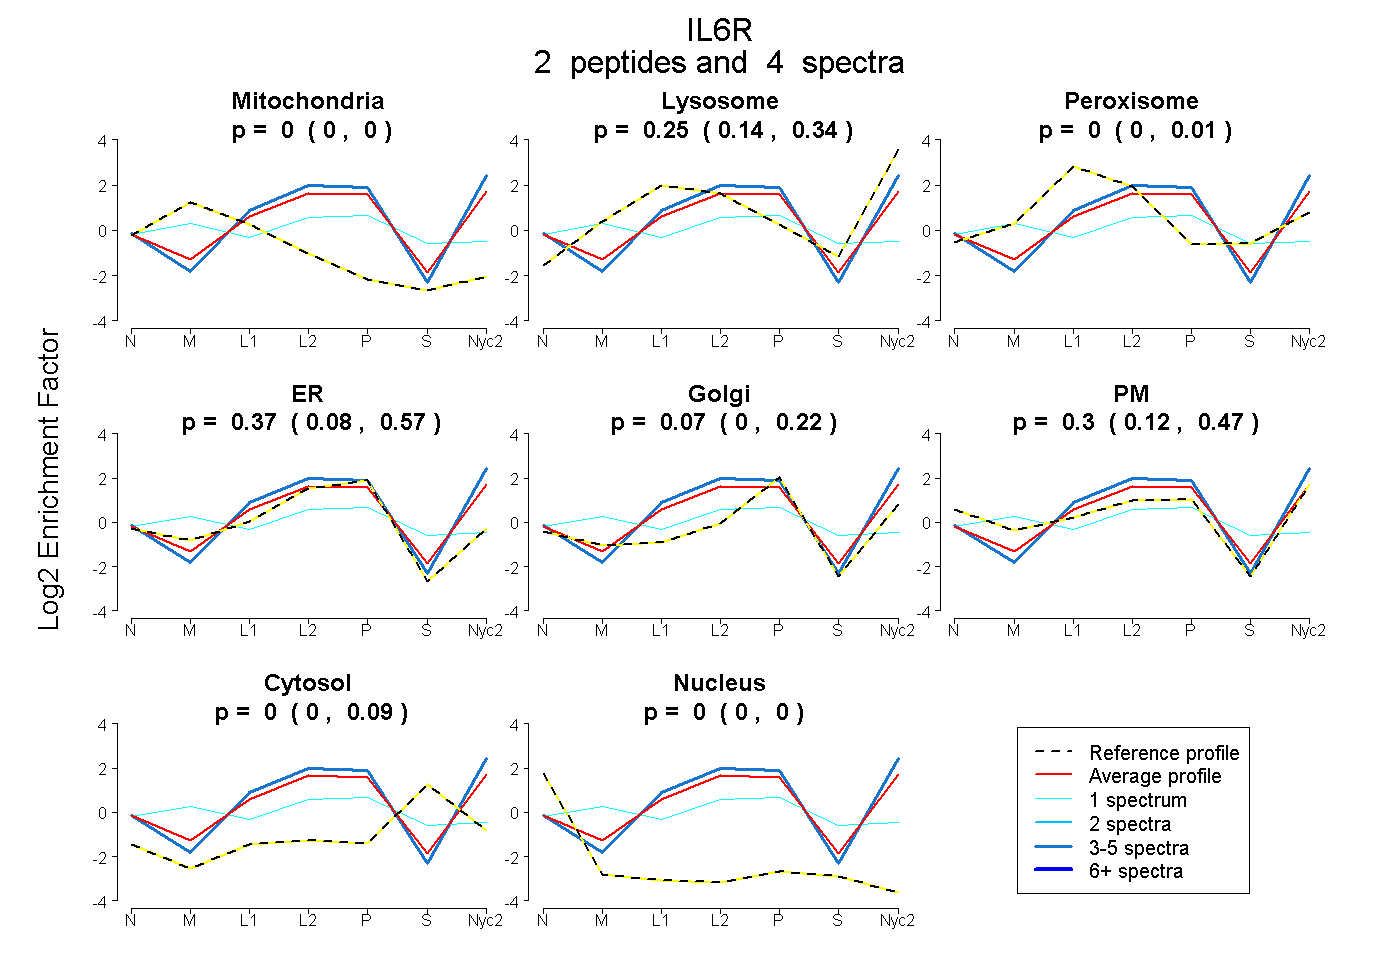
0.000 | 0.000
0.139 | 0.343
0.000 | 0.013
0.078 | 0.566
0.000 | 0.221
0.124 | 0.471
0.000 | 0.085
0.000 | 0.000
| Plot | Mito | Lyso | Perox | ER | Golgi | PM | Cytosol | Nucleus | |||||
| Expt A |
2 peptides |
4 spectra |
|
0.000 0.000 | 0.000 |
0.255 0.139 | 0.343 |
0.000 0.000 | 0.013 |
0.366 0.078 | 0.566 |
0.072 0.000 | 0.221 |
0.304 0.124 | 0.471 |
0.004 0.000 | 0.085 |
0.000 0.000 | 0.000 |
| 3 spectra, MVQPDPPANLVVSAIPGRPR | 0.000 | 0.286 | 0.000 | 0.302 | 0.001 | 0.410 | 0.000 | 0.000 | ||
| 1 spectrum, SFSCEVEILEGDK | 0.141 | 0.000 | 0.190 | 0.317 | 0.146 | 0.000 | 0.207 | 0.000 |
| Plot | Lyso | Other | |||||||||||
| Expt C |
4 peptides |
9 spectra |
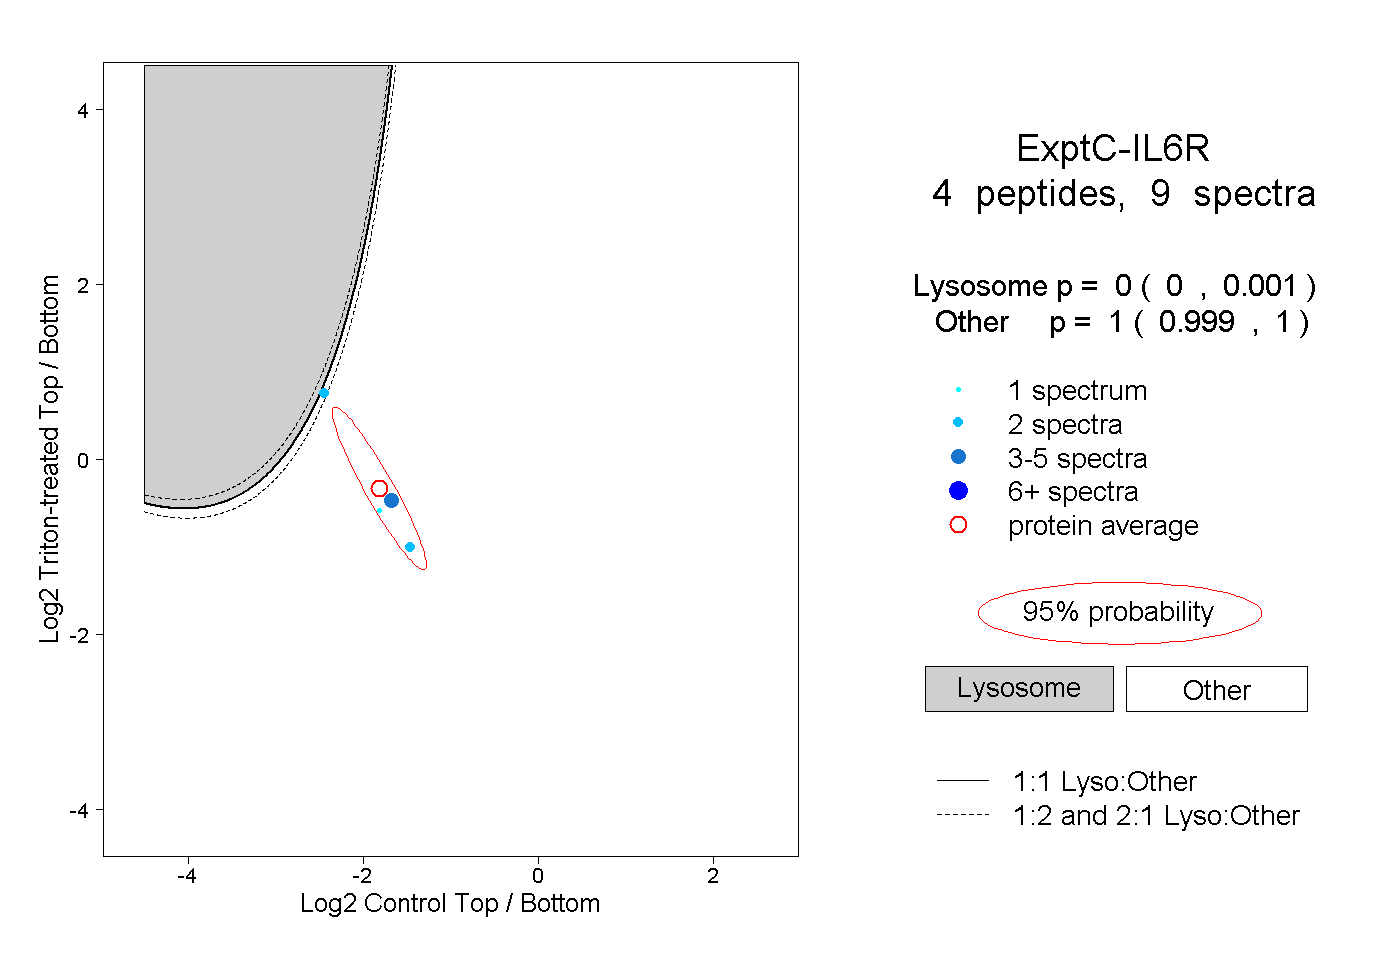 |
0.000 0.000 | 0.001 |
1.000 0.999 | 1.000 |