 2
2peptides
spectra
0.000 | 0.000
0.000 | 0.000
0.000 | 0.084
0.000 | 0.043
0.000 | 0.000
0.000 | 0.000
0.416 | 0.499
0.443 | 0.529
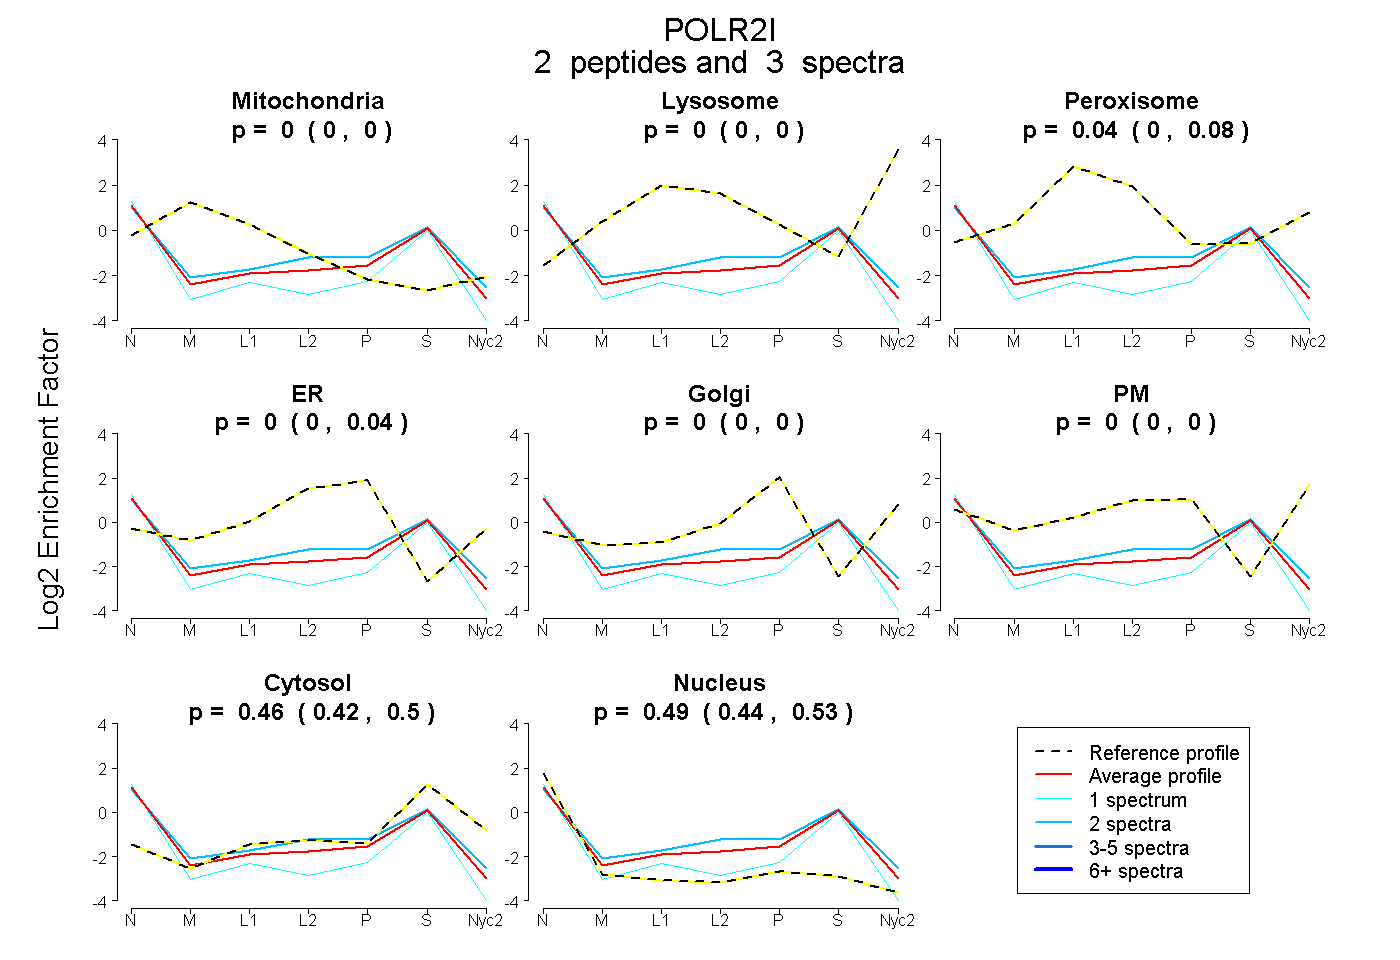
| Plot | Mito | Lyso | Perox | ER | Golgi | PM | Cytosol | Nucleus | |||||
| Expt A |
2 peptides |
3 spectra |
|
0.000 0.000 | 0.000 |
0.000 0.000 | 0.000 |
0.044 0.000 | 0.084 |
0.000 0.000 | 0.043 |
0.000 0.000 | 0.000 |
0.000 0.000 | 0.000 |
0.461 0.416 | 0.499 |
0.494 0.443 | 0.529 |
| 1 spectrum, ILLYACR | 0.000 | 0.000 | 0.000 | 0.000 | 0.000 | 0.000 | 0.346 | 0.654 | ||
| 2 spectra, TEDHPCQK | 0.000 | 0.000 | 0.091 | 0.051 | 0.000 | 0.000 | 0.446 | 0.412 |