 4
4peptides
spectra
0.000 | 0.000
0.000 | 0.000
0.000 | 0.000
0.192 | 0.253
0.000 | 0.045
0.000 | 0.000
0.041 | 0.068
0.686 | 0.710
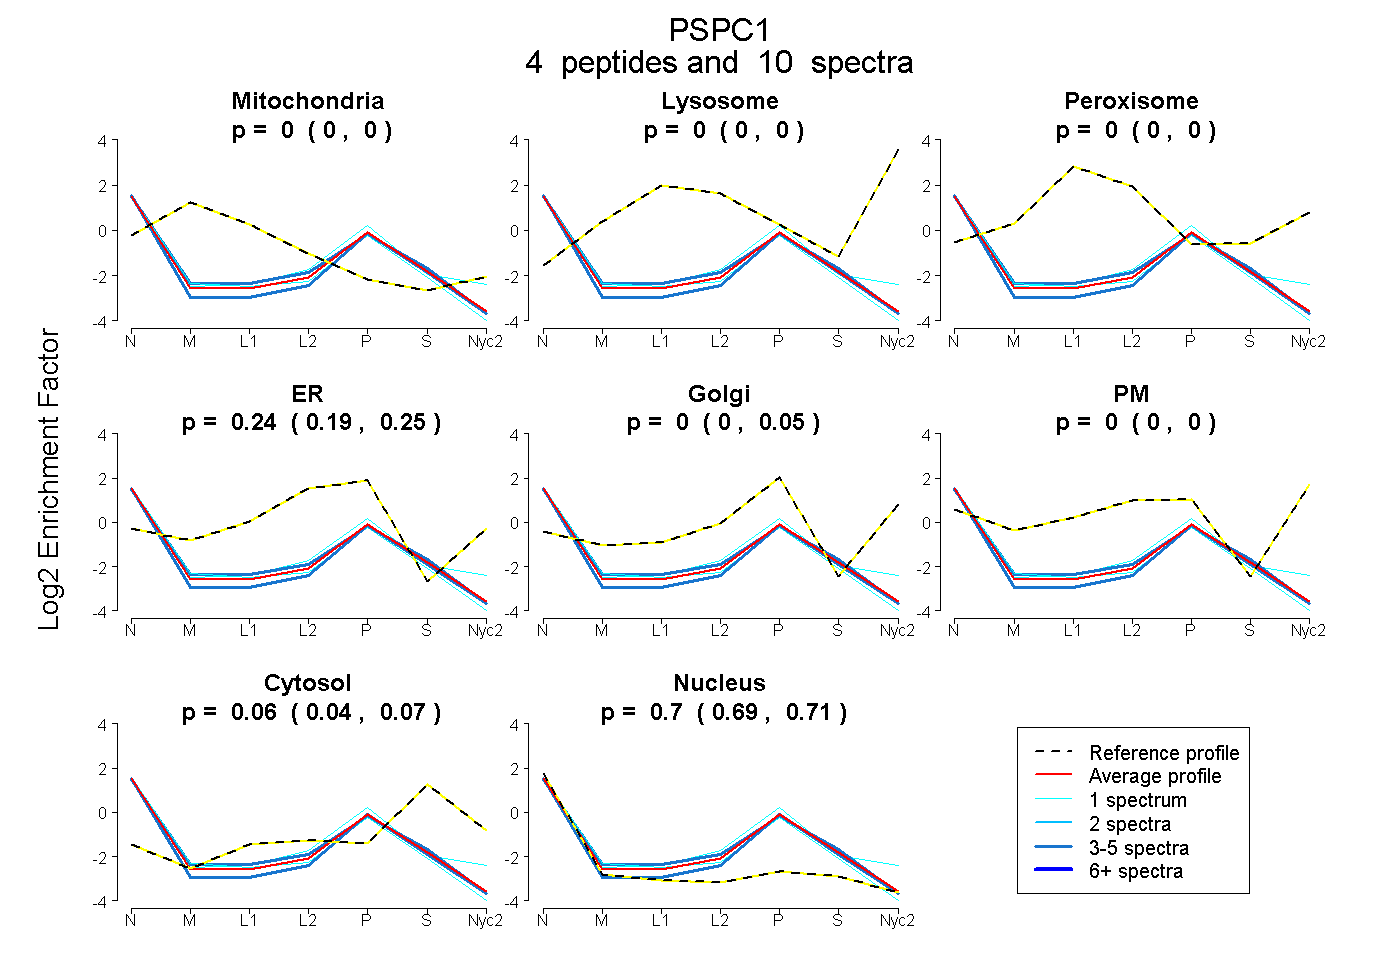
| Plot | Mito | Lyso | Perox | ER | Golgi | PM | Cytosol | Nucleus | |||||
| Expt A |
4 peptides |
10 spectra |
|
0.000 0.000 | 0.000 |
0.000 0.000 | 0.000 |
0.000 0.000 | 0.000 |
0.242 0.192 | 0.253 |
0.002 0.000 | 0.045 |
0.000 0.000 | 0.000 |
0.057 0.041 | 0.068 |
0.700 0.686 | 0.710 |
| 4 spectra, YGEPSEVFINR | 0.000 | 0.000 | 0.000 | 0.077 | 0.129 | 0.000 | 0.044 | 0.750 | ||
| 1 spectrum, SFLKPGEK | 0.000 | 0.000 | 0.000 | 0.241 | 0.000 | 0.000 | 0.000 | 0.759 | ||
| 4 spectra, FAQPGTFEFEYASR | 0.000 | 0.000 | 0.000 | 0.255 | 0.000 | 0.000 | 0.073 | 0.672 | ||
| 1 spectrum, ALDEMEK | 0.000 | 0.000 | 0.000 | 0.086 | 0.306 | 0.000 | 0.030 | 0.578 |
| Plot | Mito | Lyso or Perox | ER | Golgi | PM | Cytosol | Nucleus | ||||||
| Expt B |
1 peptide |
1 spectrum |
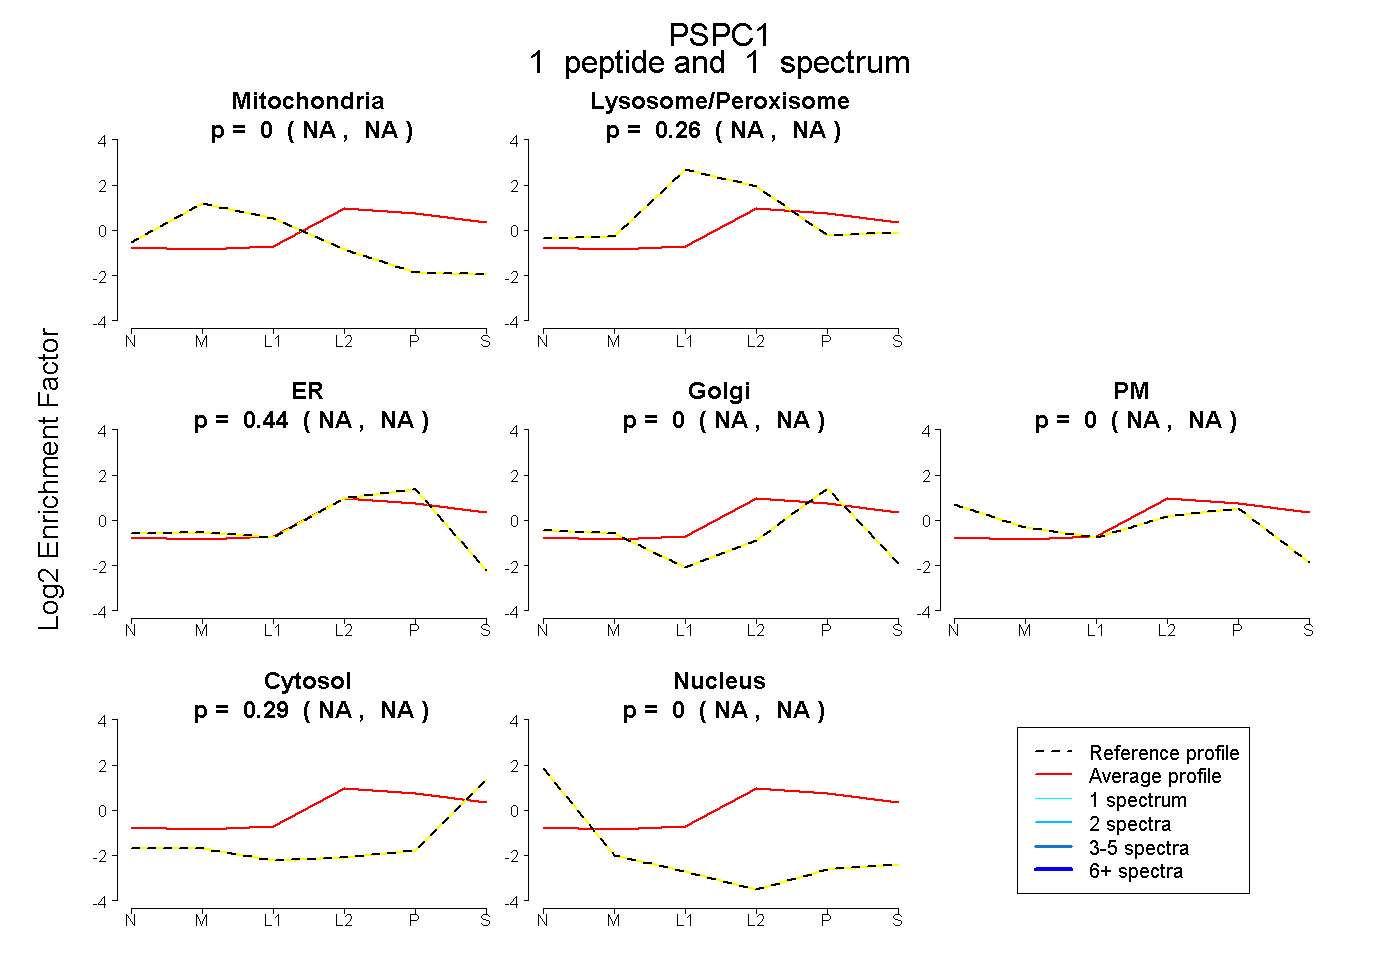 |
0.000 NA | NA |
0.264 NA | NA |
0.445 NA | NA |
0.000 NA | NA |
0.000 NA | NA |
0.292 NA | NA |
0.000 NA | NA |
|||
| Plot | Lyso | Other | |||||||||||
| Expt C |
2 peptides |
4 spectra |
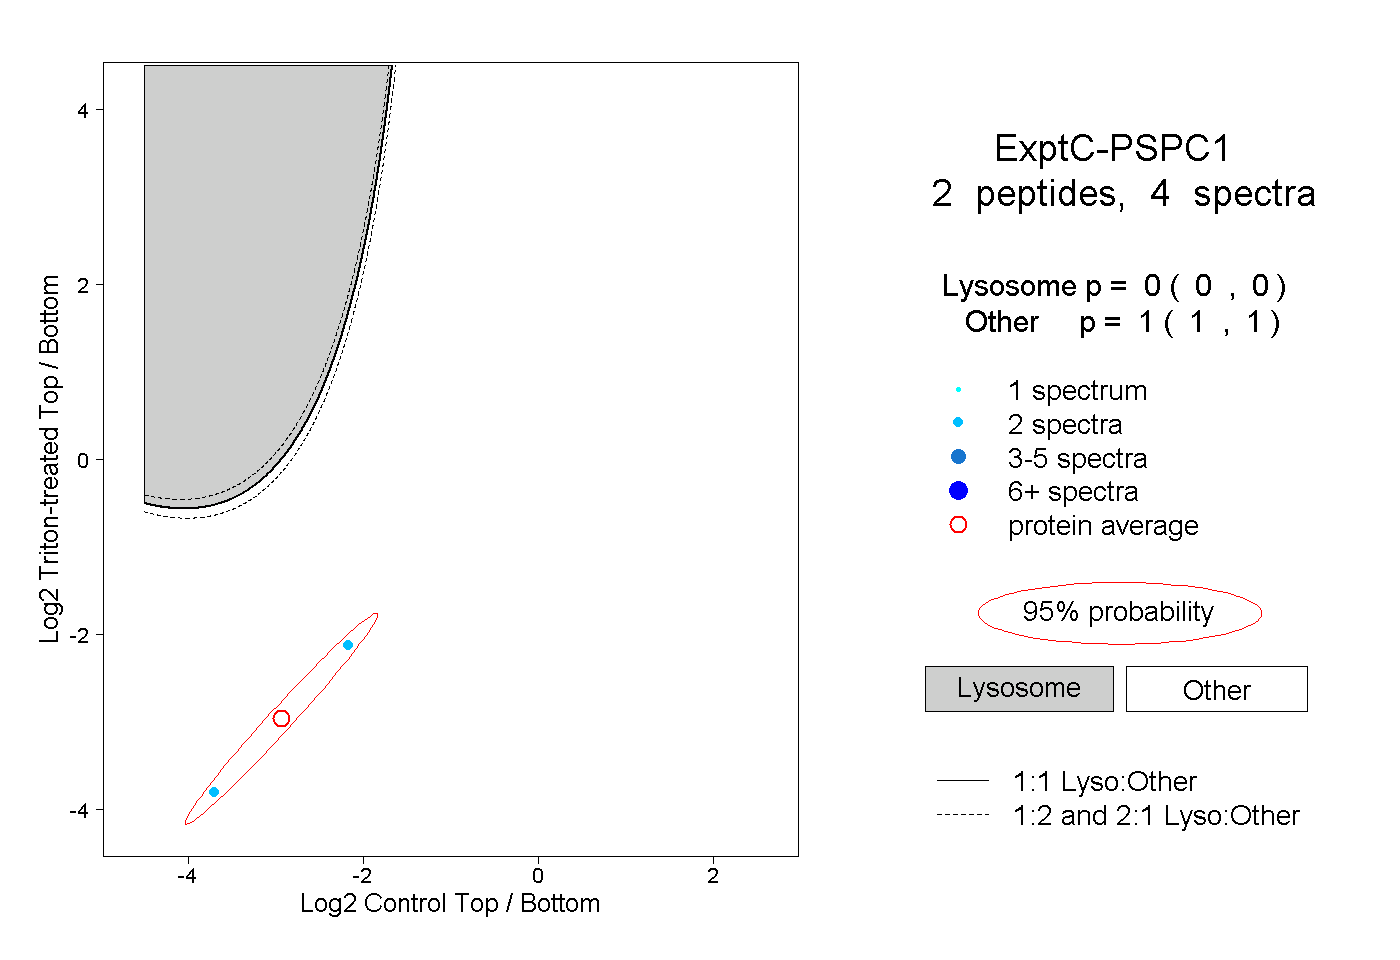 |
0.000 0.000 | 0.000 |
1.000 1.000 | 1.000 |
||||||||
| Plot | Lyso | Other | |||||||||||
| Expt D |
1 peptide |
1 spectrum |
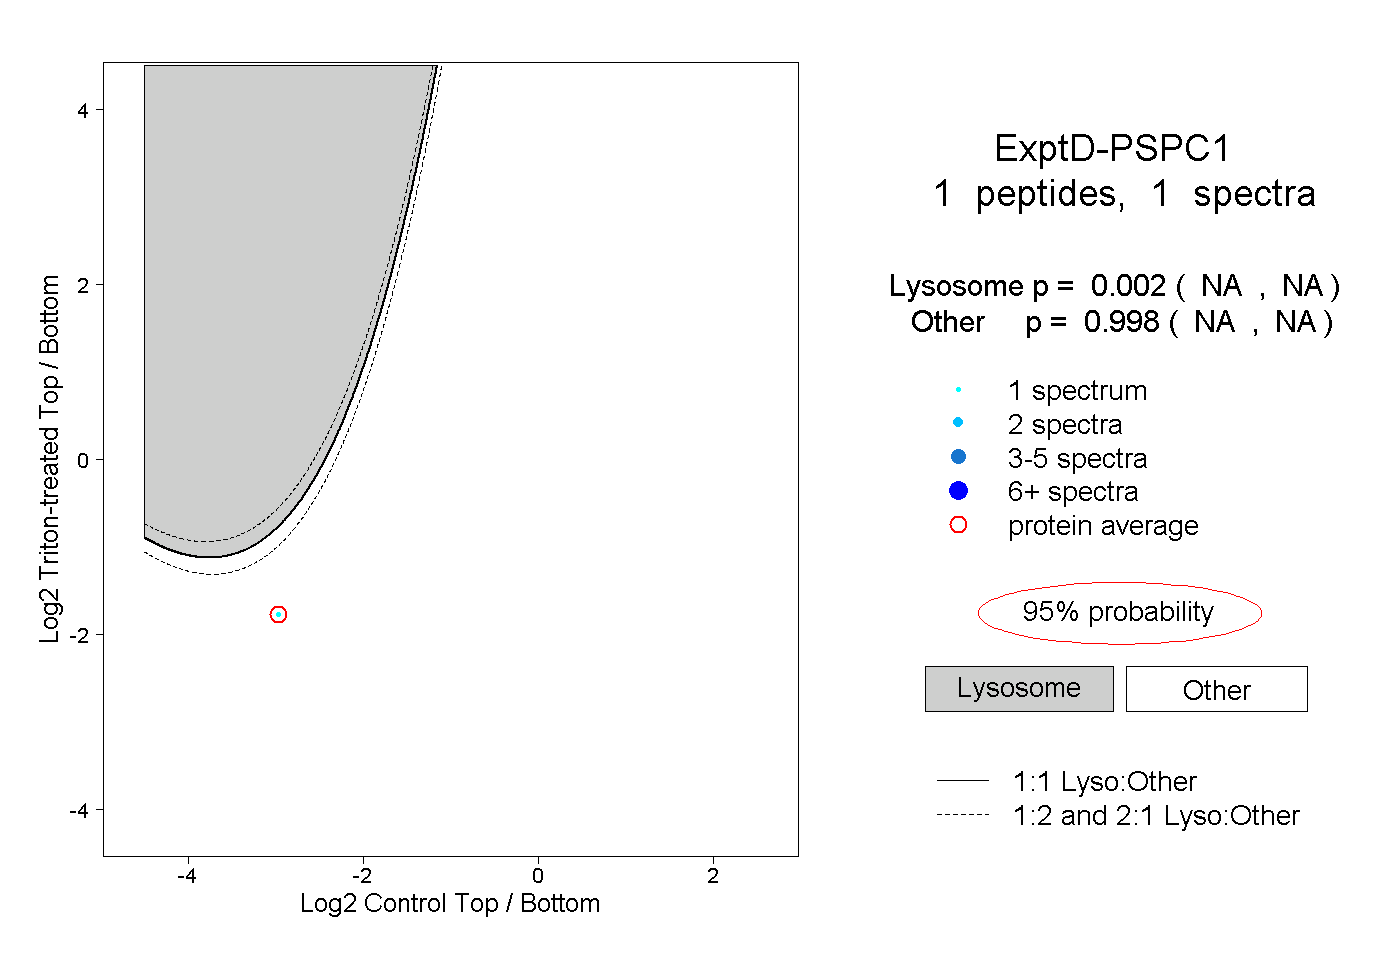 |
0.002 NA | NA |
0.998 NA | NA |