 4
4peptides
spectra
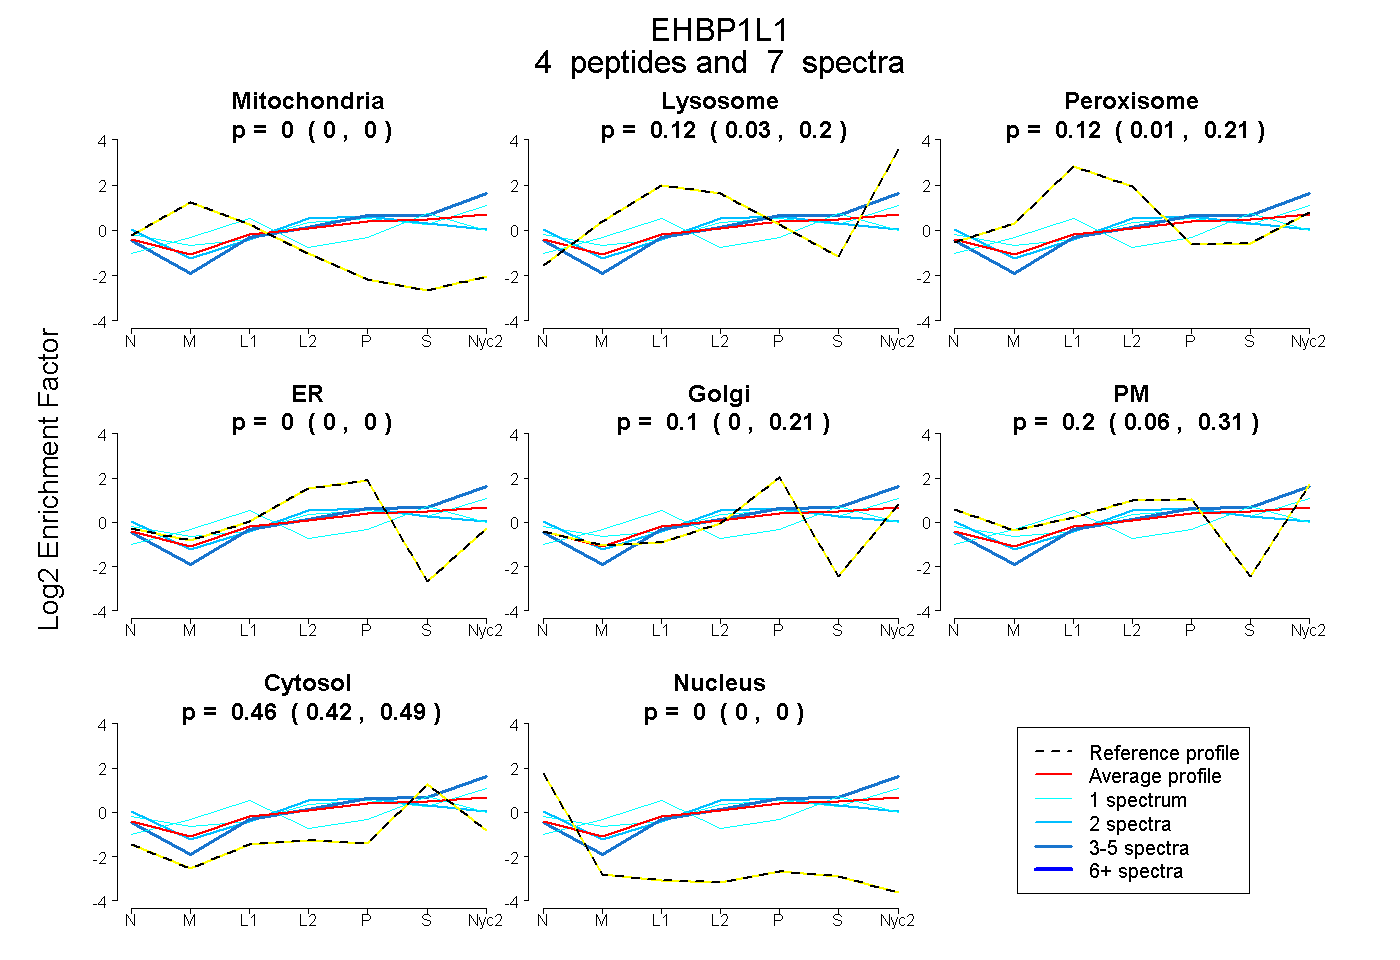
0.000 | 0.000
0.030 | 0.195
0.013 | 0.214
0.000 | 0.000
0.000 | 0.209
0.057 | 0.309
0.418 | 0.487
0.000 | 0.000
| Plot | Mito | Lyso | Perox | ER | Golgi | PM | Cytosol | Nucleus | |||||
| Expt A |
4 peptides |
7 spectra |
|
0.000 0.000 | 0.000 |
0.123 0.030 | 0.195 |
0.121 0.013 | 0.214 |
0.000 0.000 | 0.000 |
0.102 0.000 | 0.209 |
0.198 0.057 | 0.309 |
0.457 0.418 | 0.487 |
0.000 0.000 | 0.000 |
| 3 spectra, LVVVWTR | 0.000 | 0.280 | 0.000 | 0.000 | 0.130 | 0.124 | 0.467 | 0.000 | ||
| 1 spectrum, SGIPEAQETEAK | 0.088 | 0.125 | 0.264 | 0.000 | 0.023 | 0.000 | 0.502 | 0.000 | ||
| 1 spectrum, EWTFIIENESK | 0.000 | 0.184 | 0.000 | 0.000 | 0.000 | 0.408 | 0.408 | 0.000 | ||
| 2 spectra, GTEAHGARPEPDIEVR | 0.000 | 0.000 | 0.113 | 0.222 | 0.000 | 0.226 | 0.439 | 0.000 |
| Plot | Lyso | Other | |||||||||||
| Expt C |
2 peptides |
12 spectra |
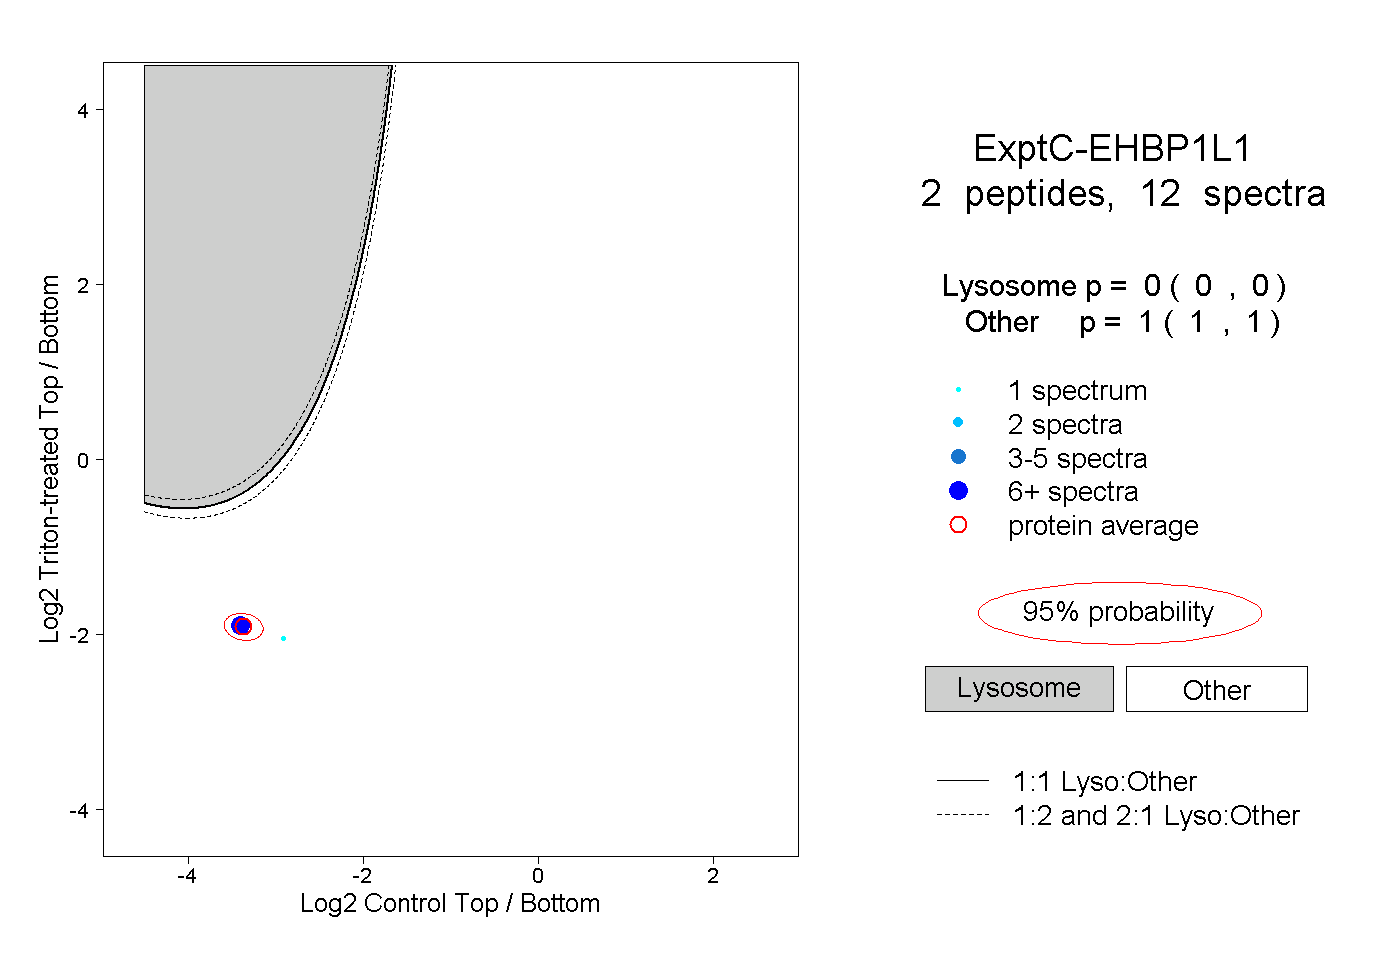 |
0.000 0.000 | 0.000 |
1.000 1.000 | 1.000 |